

Novo Nordisk A/S Stock (NVO) Moved Down by 7.86% on Sep 21: A Full Analysis

Source Tradingkey

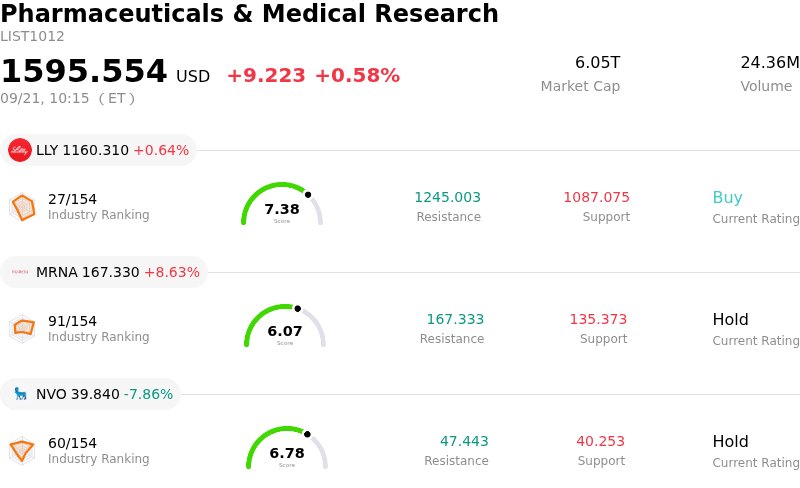
Novo Nordisk A/S (NVO) moved down by 7.86%. The Pharmaceuticals & Medical Research sector is up by 0.58%. The company underperformed the industry. Top 3 stocks by turnover in the sector: Eli Lilly and Co (LLY) up 0.64%; Moderna Inc (MRNA) up 8.63%; Novo Nordisk A/S (NVO) down 7.86%.
SummaryOverview

What is driving Novo Nordisk A/S (NVO)’s stock price down today?

Novo Nordisk experienced significant downward pressure following its 2026 Capital Markets Day, where executive management presented updated long-term strategic targets. Although the company outlined plans to launch multiple multi-blockbuster therapies by 2030 and expand its pipeline revenue substantially by 2035, the updated targets failed to reignite investor enthusiasm. The market reacted coolly to the timeline, as many of the outlined growth drivers remain years away from commercialization, leaving investors concerned over the lack of concrete near-term catalysts to accelerate top-line expansion.

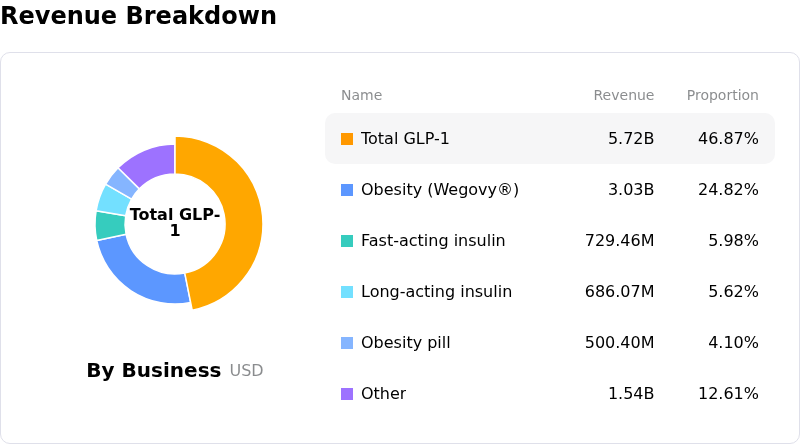
Compounding the negative sentiment is the growing competitive threat in the metabolic care and weight-loss space. Main rival Eli Lilly continues to capture market share, squeezing growth for Novo Nordisk's flagship semaglutide franchise. Furthermore, concentration risk remains high, with semaglutide-based treatments generating the vast majority of current revenue. With key patent expirations approaching in the early 2030s, Wall Street has expressed heightened concern over the company's ability to defend its market dominance against generic and branded alternatives, leading to recent institutional rating downgrades.

Even positive clinical updates failed to offset the prevailing risk-off mood. Novo Nordisk announced promising Phase 3 topline data for its next-generation weight management product, CagriSema, demonstrating robust efficacy in weight reduction and blood sugar control. However, market focus remained squarely on long-term market share erosion and execution uncertainty. While the company maintains an active share buyback program and a solid underlying balance sheet, investors opted to reduce exposure as they weigh near-term commercial hurdles against ambitious long-term targets.

Technical Analysis of Novo Nordisk A/S (NVO)

Technically, Novo Nordisk A/S (NVO) shows a MACD (12,26,9) value of -0.874, indicating a sell signal. The RSI at 31.412 suggests neutral condition and the Williams %R at 98.926 suggests oversold condition. Please monitor closely.

Fundamental Analysis of Novo Nordisk A/S (NVO)

Novo Nordisk A/S (NVO) is in the Pharmaceuticals & Medical Research industry. Its latest annual revenue is $46.70B, ranking 12 in the industry. The net profit is $15.48B, ranking 4 in the industry. Company Profile
FundamentalAnalysis

Over the past month, multiple analysts have rated the company as Hold, with an average price target of $49.21, a high of $65.00, and a low of $40.00.

More details about Novo Nordisk A/S (NVO)

Company Specific Risks:

  • Sluggish Long-Term Guidance from Capital Markets Day: Capital Markets Day targets project revenue growth from 2026 to 2030 to merely align with industry peers, confirming a significant deceleration from past high-growth trajectories and triggering immediate intraday selling pressure.
  • Semaglutide Patent Expiry and Concentration Risk: Semaglutide-based therapies generate over 75% of total sales, exposing the company to major revenue cliff risks as leadership highlighted the 2032 U.S. patent expiration without presenting sufficient near-term pipeline catalysts.
  • Market Share Erosion and Competitive Pressure from Eli Lilly: Rival GLP-1 treatments Zepbound and Mounjaro continue to aggressively capture U.S. market share, with Zepbound sales projected to outpace Wegovy by more than $7 billion this year.
  • Institutional Analyst Downgrades and Valuation Re-ratings: Wall Street brokerages, including Morgan Stanley downgrading the stock to Underweight, cite muted medium-term growth prospects and pipeline lag, sparking ongoing institutional derisking.
Disclaimer: For information purposes only. Past performance is not indicative of future results.
placeholder
Bitcoin falls below $75,000 as the CLARITY Act fails in the Senate — what the vote means for cryptoThe US Senate blocked the Digital Asset Market CLARITY Act in a 49-50 procedural vote, sending Bitcoin briefly below $75,000 — its biggest one-day drop since June. Ethereum fell more than 8%, Coinbase slid 10% and $75 billion of crypto market value evaporated. Here is what the vote was, why it failed, and the levels that matter now.
Author  Suzie
Sep 16, Wed
The US Senate blocked the Digital Asset Market CLARITY Act in a 49-50 procedural vote, sending Bitcoin briefly below $75,000 — its biggest one-day drop since June. Ethereum fell more than 8%, Coinbase slid 10% and $75 billion of crypto market value evaporated. Here is what the vote was, why it failed, and the levels that matter now.
placeholder
Dollar index tops 100 for the first time since July as the Fed's hawkish dot plot sinks inThe U.S. dollar index broke back above 100 for the first time since 31 July after the Fed delivered its first rate hike since 2023, with the dot plot showing 16 of 18 officials expect at least one more increase this year. Here are the levels that matter for DXY, the currencies feeling it most, and what to watch next.
Author  Irene Q.
Sep 17, Thu
The U.S. dollar index broke back above 100 for the first time since 31 July after the Fed delivered its first rate hike since 2023, with the dot plot showing 16 of 18 officials expect at least one more increase this year. Here are the levels that matter for DXY, the currencies feeling it most, and what to watch next.
placeholder
Gold ends three-week slide at the $4,400 line — eight straight days of ETF inflows vs a 5% 10-year and a 100 dollarSpot gold closed Friday at $4,378.39, up 0.84% on the day and about 0.8% for the week — its first weekly gain in four weeks — with the intraday high of $4,399.67 leaving it 33 cents shy of the $4,400 line. Gold ETFs have now logged eight straight sessions of inflows, but with the 10-year back above 5% and the dollar index near 100, here is what decides whether this is a reversal or a bounce.
Author  Suzie
Yesterday 05: 53
Spot gold closed Friday at $4,378.39, up 0.84% on the day and about 0.8% for the week — its first weekly gain in four weeks — with the intraday high of $4,399.67 leaving it 33 cents shy of the $4,400 line. Gold ETFs have now logged eight straight sessions of inflows, but with the 10-year back above 5% and the dollar index near 100, here is what decides whether this is a reversal or a bounce.
placeholder
Bitcoin squeezes back above $80,000 — 110,000 traders liquidated as the hawkish Fed and CLARITY setback fail to hold it down; is $83,000 next?Bitcoin closed above $80,000 on Friday for the first time since September 7, and pushed to $81,299 over the weekend, triggering about $603 million of liquidations — $523 million of them shorts — across more than 110,000 traders. With the Fed's hike already priced and the SEC and CFTC advancing crypto rules after the CLARITY Act failed, here is what stands between BTC and the $83,000 gate.
Author  Suzie
Yesterday 06: 19
Bitcoin closed above $80,000 on Friday for the first time since September 7, and pushed to $81,299 over the weekend, triggering about $603 million of liquidations — $523 million of them shorts — across more than 110,000 traders. With the Fed's hike already priced and the SEC and CFTC advancing crypto rules after the CLARITY Act failed, here is what stands between BTC and the $83,000 gate.
placeholder
Brent slides below $102 after Houthis' first strike on Riyadh — why oil can't hold $100Houthi forces struck Riyadh for the first time on September 19 and hit Yanbu facilities — yet Brent opened at $104.71, peaked at $104.90 and settled at $101.68 (-1.63% on the day). Here is the four-way data tug-of-war between strike escalation and supply recovery, and the two switches that decide where oil goes next.
Author  Irene Q.
12 hours ago
Houthi forces struck Riyadh for the first time on September 19 and hit Yanbu facilities — yet Brent opened at $104.71, peaked at $104.90 and settled at $101.68 (-1.63% on the day). Here is the four-way data tug-of-war between strike escalation and supply recovery, and the two switches that decide where oil goes next.
goTop
quote