

XRP Price Strengthens — Eyes Set on Key Resistance Levels

Source Newsbtc

XRP price started a decent upward move from the $2.20 zone. The price is now showing positive signs and might aim for a move above the $2.285 resistance.

  • XRP price started a fresh increase above the $2.2320 zone.
  • The price is now trading above $2.2320 and the 100-hourly Simple Moving Average.
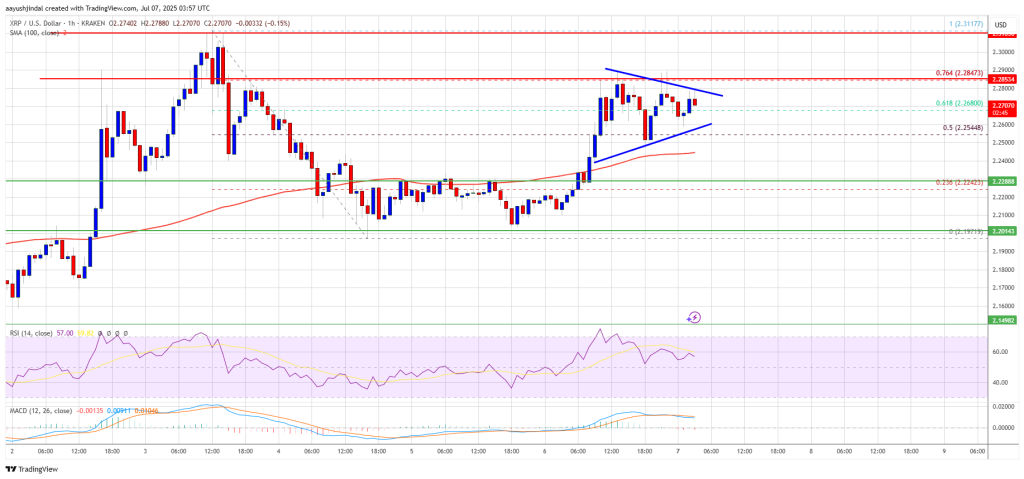
  • There is a short-term contracting triangle forming with resistance at $2.280 on the hourly chart of the XRP/USD pair (data source from Kraken).
  • The pair could start another increase if it clears the $2.280 zone.

XRP Price Faces Resistance

XRP price started a fresh increase after it settled above the $2.220 level, like Bitcoin and Ethereum. The price was able to climb above the $2.2320 resistance level.

The bulls were able to push the price above the $2.250 level. Moreover, there was a clear move above the 61.8% Fib retracement level of the downward move from the $2.3111 swing high to the $2.197 low. The price is now trading above $2.250 and the 100-hourly Simple Moving Average.

On the upside, the price might face resistance near the $2.280 level. There is also a short-term contracting triangle forming with resistance at $2.280 on the hourly chart of the XRP/USD pair.
XRP Price

The first major resistance is near the $2.2850 level. It is close to the 76.4% Fib retracement level of the downward move from the $2.3111 swing high to the $2.197 low. The next resistance is $2.320. A clear move above the $2.320 resistance might send the price toward the $2.350 resistance. Any more gains might send the price toward the $2.40 resistance or even $2.420 in the near term. The next major hurdle for the bulls might be $2.50.

Another Decline?

If XRP fails to clear the $2.2850 resistance zone, it could start another decline. Initial support on the downside is near the $2.260 level. The next major support is near the $2.2320 level.

If there is a downside break and a close below the $2.2320 level, the price might continue to decline toward the $2.20 support. The next major support sits near the $2.150 zone.

Technical Indicators

Hourly MACD – The MACD for XRP/USD is now gaining pace in the bullish zone.

Hourly RSI (Relative Strength Index) – The RSI for XRP/USD is now above the 50 level.

Major Support Levels – $2.2320 and $2.20.

Major Resistance Levels – $2.2850 and $2.320.

Disclaimer: For information purposes only. Past performance is not indicative of future results.
placeholder
Gold posts first weekly gain in three weeks — can $4,200 hold through CPI?Spot gold closed at $4,194.645, up 1.47% — its first weekly gain in three weeks — and COMEX futures settled back above $4,200 at $4,220.30. Here are the drivers, the levels and the scenarios into Wednesday's CPI.
Author  Irene Q.
15 hours ago
Spot gold closed at $4,194.645, up 1.47% — its first weekly gain in three weeks — and COMEX futures settled back above $4,200 at $4,220.30. Here are the drivers, the levels and the scenarios into Wednesday's CPI.
placeholder
US September CPI preview: inflation set to hit 3.7% — will the Fed hike in December?US September CPI lands Wednesday with headline inflation seen at 3.7% y/y and core at 0.2% m/m. December hike odds sit near 70% — here are the scenarios, the calendar and the key levels.
Author  Irene Q.
17 hours ago
US September CPI lands Wednesday with headline inflation seen at 3.7% y/y and core at 0.2% m/m. December hike odds sit near 70% — here are the scenarios, the calendar and the key levels.
placeholder
Gold Price Forecast: Gold Rebounds Above $4,200, Can Falling Oil Prices Drive Another Rally?As of Friday (October 9), gold prices (XAUUSD) rebounded noticeably after consecutive declines. During today's Asian session, gold prices briefly rebounded above $4,200, reaching an intra
Author  TradingKey
Yesterday 09: 23
As of Friday (October 9), gold prices (XAUUSD) rebounded noticeably after consecutive declines. During today's Asian session, gold prices briefly rebounded above $4,200, reaching an intra
placeholder
Hurricane Isaias has shut in a quarter of Gulf oil output — can WTI clear $92 before Thursday's EIA report?WTI trades at $90.80 after rebounding roughly 3% from Wednesday's $87.96 low as Hurricane Isaias — the Atlantic season's first — forces producers to shut in about 25% of US Gulf of Mexico output. Brent holds at $103.41. The first official read on the disruption arrives with the EIA weekly petroleum report on Thursday 15 October — here are the key levels and both scenarios.
Author  Irene Q.
Yesterday 06: 38
WTI trades at $90.80 after rebounding roughly 3% from Wednesday's $87.96 low as Hurricane Isaias — the Atlantic season's first — forces producers to shut in about 25% of US Gulf of Mexico output. Brent holds at $103.41. The first official read on the disruption arrives with the EIA weekly petroleum report on Thursday 15 October — here are the key levels and both scenarios.
placeholder
【Daily Brief】Gold rebounds 1% off a two-month low, Nasdaq drops 1.25% and yields ease — the storm premium keeps WTI near $91Gold trades at $4,174 after rebounding from Wednesday's $4,090 two-month low, the Nasdaq fell 1.25% while the Dow edged higher, and the 10-year Treasury eased to 5.23% from the week's highs. Hurricane Isaias keeps about 25% of Gulf output shut in with WTI near $91, and bitcoin holds below $82,000. The next scheduled tests are the EIA report on 15 October and the FOMC on 27-28 October.
Author  Irene Q.
Yesterday 06: 28
Gold trades at $4,174 after rebounding from Wednesday's $4,090 two-month low, the Nasdaq fell 1.25% while the Dow edged higher, and the 10-year Treasury eased to 5.23% from the week's highs. Hurricane Isaias keeps about 25% of Gulf output shut in with WTI near $91, and bitcoin holds below $82,000. The next scheduled tests are the EIA report on 15 October and the FOMC on 27-28 October.
goTop
quote