

Dogecoin more than doubles as DOGE joins WIF, PEPE, FLOKI and others in meme coin rally
- Dogecoin price has shot up 27% in the last 24 hours; up by 130% in the past eight days
- This massive upswing could see DOGE tag the $0.279 resistance next.
- Investors should be cautious and be ready to buy the dips above the $0.116 support level.
Dogecoin price has shown incredible momentum and continues to climb after the previous week’s 78% rally. Considering the massive volatility surrounding meme coins, this DOGE move is not surprising.
Also read: Week Ahead: Meme coins surge as BTC rally continues
Dogecoin price flies high
Dogecoin (DOGE) price cleared the multi-month declining trend line in October 2023, but the parabolic rally began in February 2024. So far, DOGE has soared by 130% in the past eight days. This massive upswing has shattered the $0.116 and $0.181 weekly resistance levels.
Considering the current outlook of the market where meme coins are ruling the trend, it isn’t surprising for DOGE to have rallied so much. However, the dynamics could change quickly when Bitcoin price sets up a new all-time high.
But until that happens, meme coins are likely going to continue shooting up.
Supporting this massive rally in Dogecoin price is the Relative Strength Index (RSI), which has reached the 85 level for the first time since May 2021. The green Awesome Oscillator (AO) histograms above the zero line also suggest a burst of bullish momentum, supporting this uptrend.
Read more: Memecoins market capitalization exceeds $50 billion, above NFTs, DeFi sector
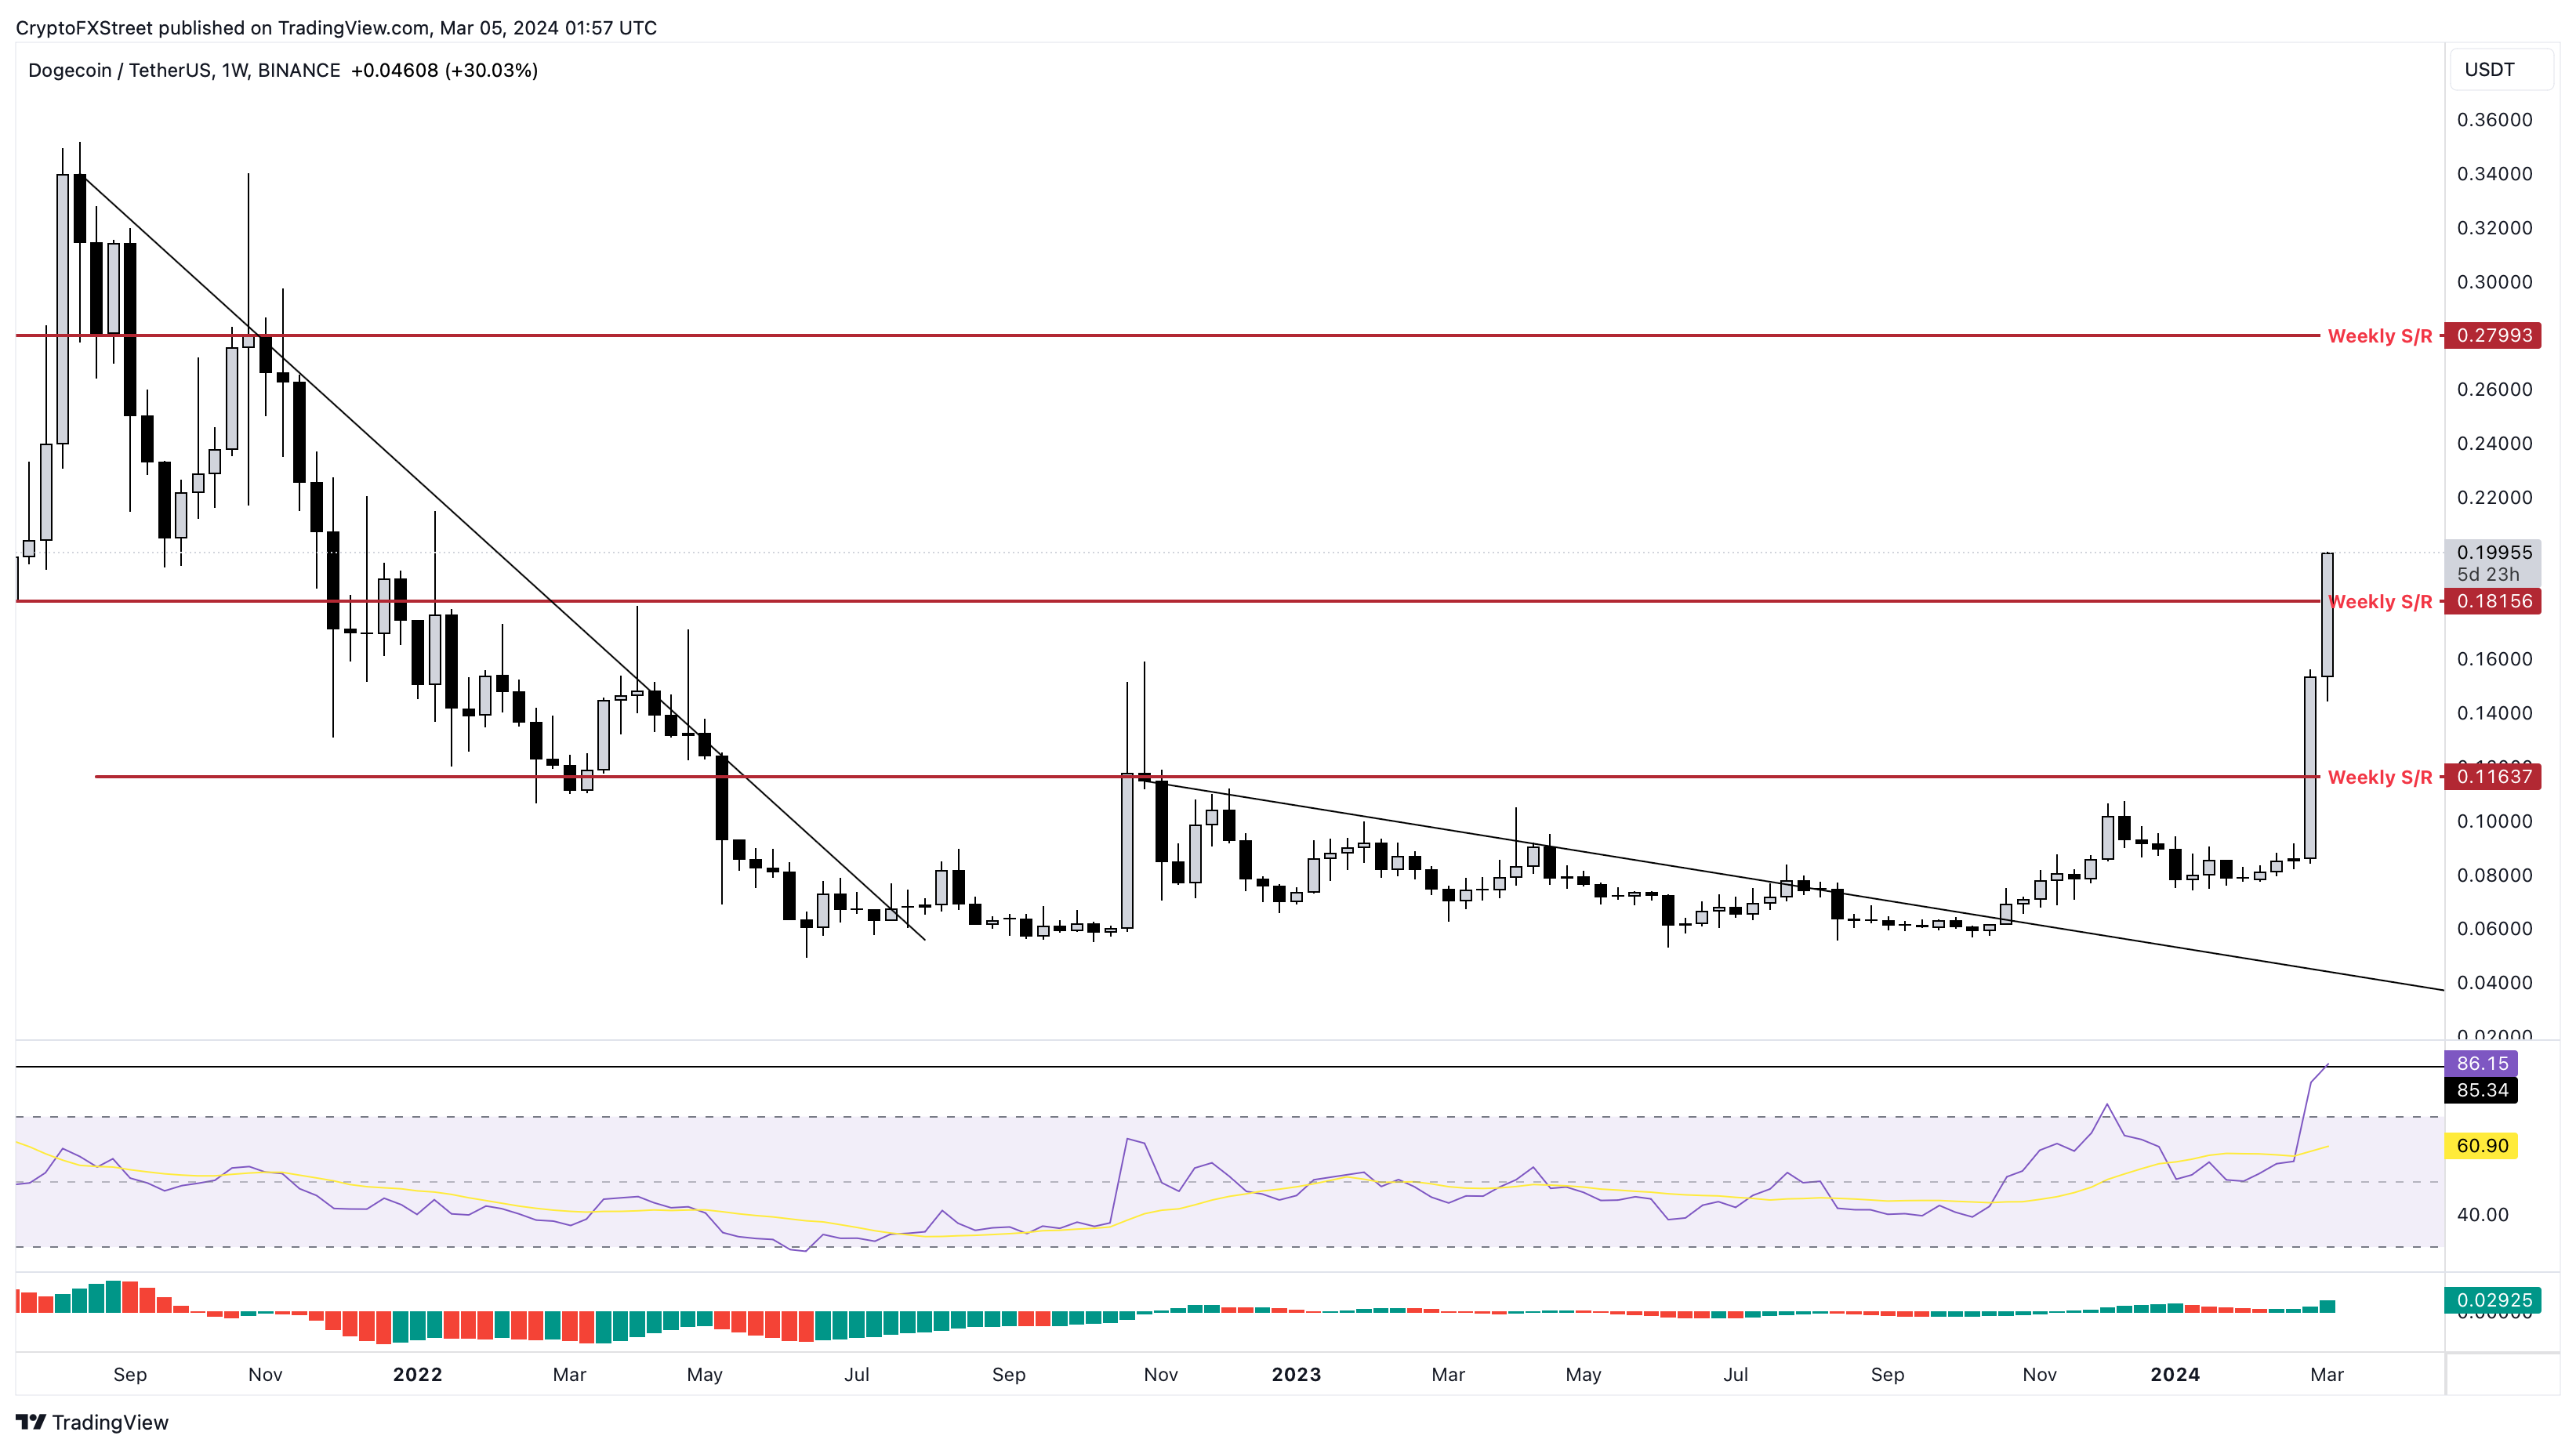
DOGE/USDT 1-week chart
According to IntoTheBlock’s Global In/Out of the Money (GIOM) indicator, the next cluster of resistance levels stretches from $0.178 to $0.671. Here, roughly 11 billion DOGE was purchased by 720,000 addresses at an average price of $0.331. Some of these addresses are already at breakeven levels, and others are Out of the Money.
So, investors that have huge unrealized profits could consider booking some around $0.331, where a major chunk of the holders could consider selling their stack at breakeven.
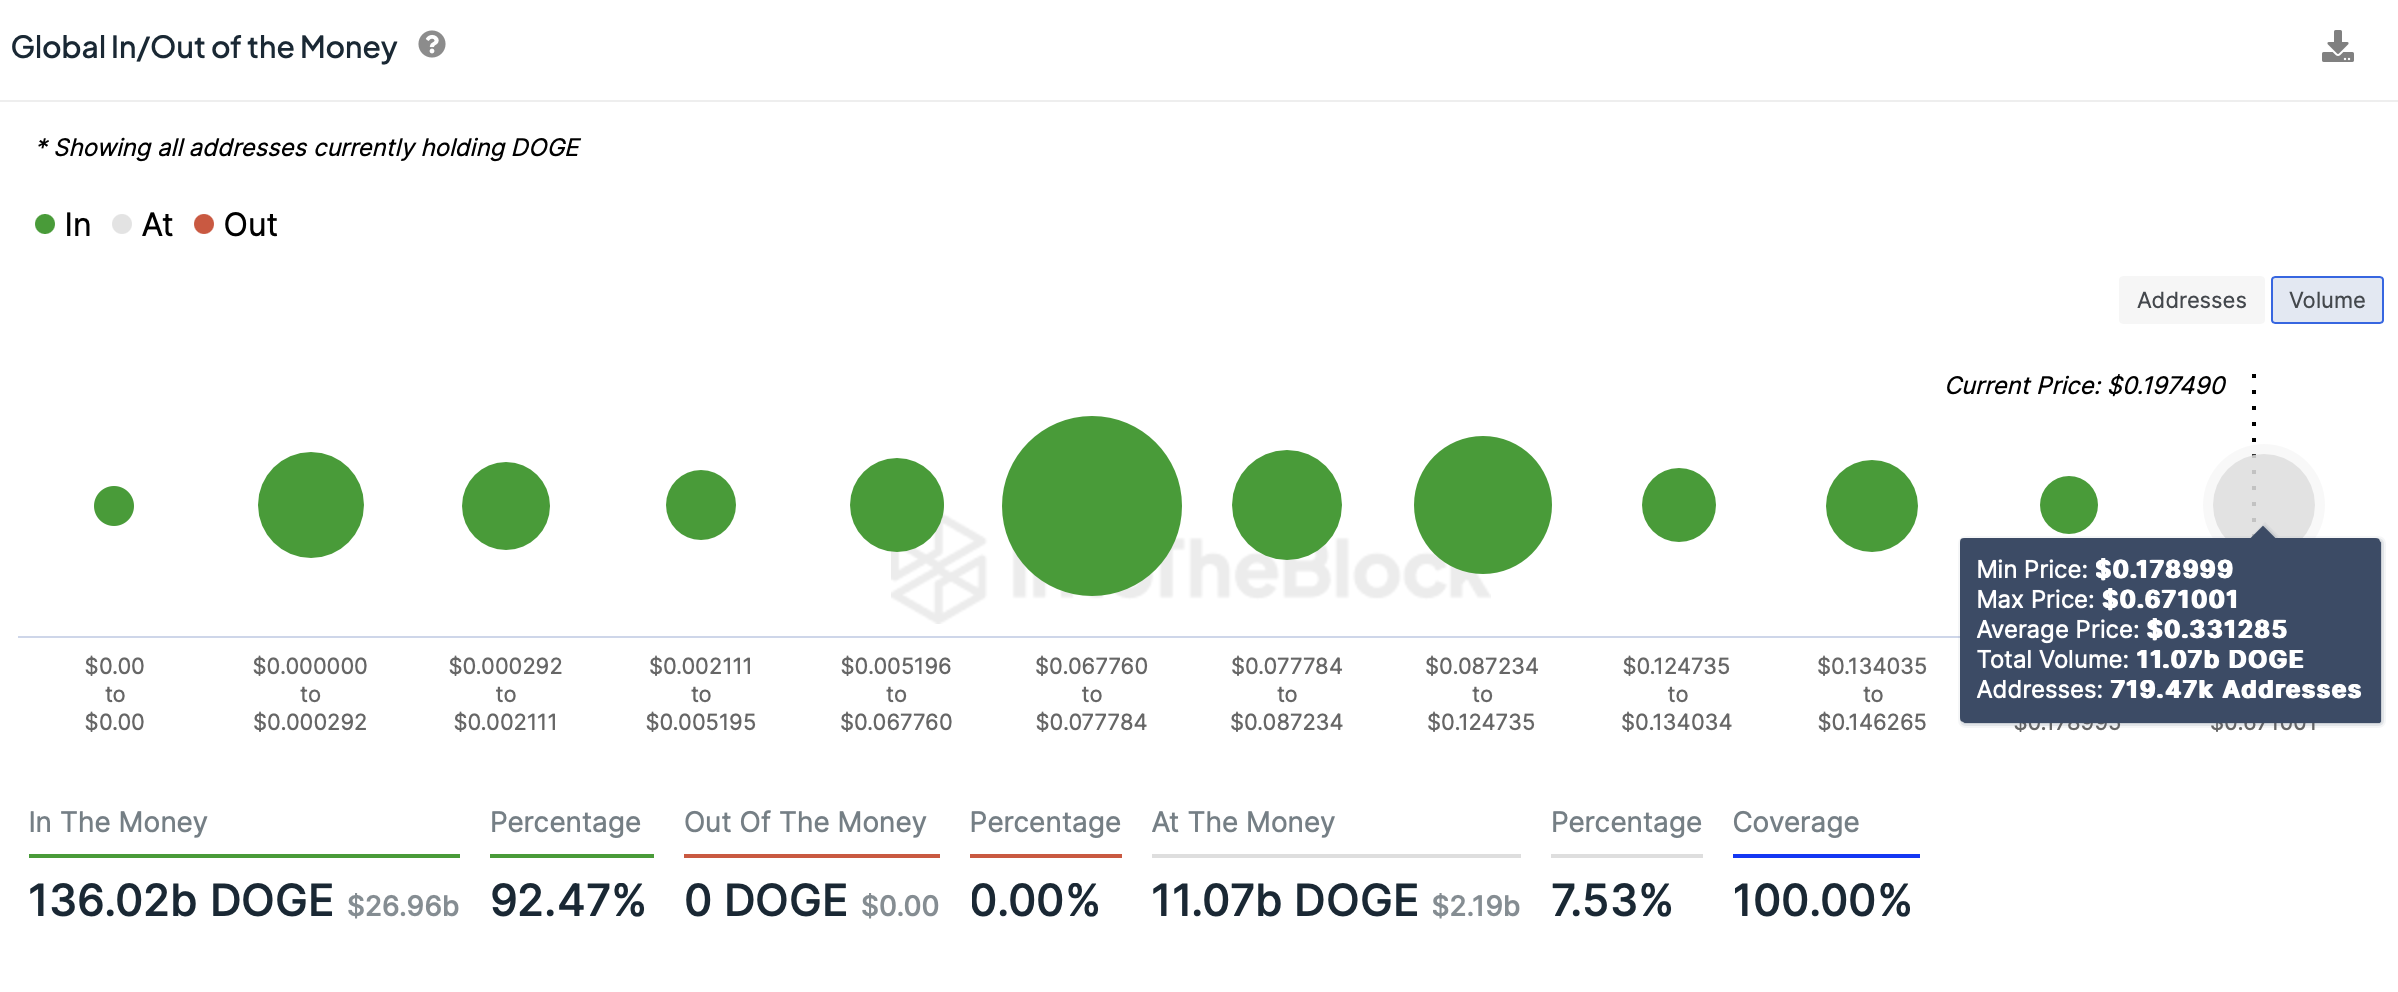
DOGE GIOM
While the outlook for Dogecoin price is bullish, it is unlikely DOGE will turn bearish, especially considering the up-only market conditions that have been prevalent for the past few months. Investors should consider setting up dollar-cost averaging upto the next key support level at $0.116.
However, if Dogecoin price flips the said weekly support level into a resistance level with a weekly candlestick close below it, it would invalidate the bullish thesis for DOGE.
Recommended Articles


