

Global M2 Vs. Bitcoin Shows Bullishness As Analyst Sets ‘Blast Off’ Date, Here’s When

Source Newsbtc

A recent analysis comparing Bitcoin’s price movement and the Global M2 money supply has added another data point to the growing argument for a bullish phase ahead for the cryptocurrency. Colin, a crypto analyst known on social media platform X as “The M2 Guy,” recently shared an update suggesting that Bitcoin may be on the verge of a significant upward move, and the expected timeline might continue to test the patience of Bitcoin traders.

Bitcoin’s Incoming Rally May Mirror M2’s Explosive Growth

Colin, a crypto analyst known on X as “The M2 Guy,” has continued to build his case around the correlation between Bitcoin and macro liquidity trends. His outlook on Bitcoin, which is currently bullish, is based on an offset correlation between the cryptocurrency’s price action on the daily candlestick chart and the global M2 money supply. 

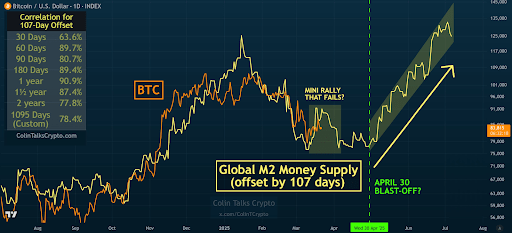
In a previous analysis, the analyst noted that Bitcoin’s price action on the daily candlestick chart has the best correlations on the 70-day and 107-day offsets. The most recent update from the analyst focuses on the 107-day offset, which he termed “the most likely scenario.”
Bitcoin

Analysis of Bitcoin’s 107-day offset with the global M2 money supply shows that Bitcoin is about to go on a blast-off spike. However, this isn’t just about a one-day spike. Colin projects the rally could last for two months based on the sharp vertical trend of the global M2 supply.

As for the timing, the 107-day offset suggests that the blast-off spike is expected to kick off around April 30 based on a mathematically strong correlation. If the M2 line continues its upward surge, the rally could last even longer.

Focus On The Macro, Not Just The Day

Although April 30 is a focal point in his projection, Colin cautioned followers not to become overly fixated on the exact date. “Don’t get caught up in the weeds,” he advised. The larger narrative is more important, reflected in the soaring global M2 levels, which should create an environment ripe for Bitcoin and other crypto assets to benefit from increased liquidity. 

In terms of a price target, the current trajectory of the global M2 money supply points to a rally above $140,000. However, interesting predictions have suggested that the Bitcoin price has a chance of doubling before the end of 2025.

At the time of writing, Bitcoin is trading at $84,310, having spent the last 24 hours trading in a range between $83,700 and $84,300. Based on this analysis of correlation with the global M2 money, bullish Bitcoin investors might need to wait for at least another month before any significant movement. 

This delay might pose challenges for short-term traders depending on their positioning and risk tolerance. On the other hand, it gives long-term holders the opportunity to accumulate more bitcoins at the current low price before the predicted rally.

Bitcoin
Disclaimer: For information purposes only. Past performance is not indicative of future results.
placeholder
Brent Crude Oil Price Forecast: Trump Eases Sanctions on Russia, Oil Prices Under Pressure Below $110, Can They Still Rise?On Monday (October 19), Brent (UKOIL) crude oil prices fell noticeably at the open today after a sharp rally last Friday. As of press time, oil prices were down about 2.1%, trading near $
Author  TradingKey
10 hours ago
On Monday (October 19), Brent (UKOIL) crude oil prices fell noticeably at the open today after a sharp rally last Friday. As of press time, oil prices were down about 2.1%, trading near $
placeholder
Bitcoin's double top at $88,000: why $78,000 is the line that decides the next moveBitcoin trades near $82,500 (+0.47%) after twice failing at the $88,000 area, forming a potential double top with a neckline at $78,000. A break below the neckline would project a measured target near $68,200; a close back above $88,000 would invalidate the pattern. Here are the structure, the levels and what would confirm either side.
Author  Suzie
13 hours ago
Bitcoin trades near $82,500 (+0.47%) after twice failing at the $88,000 area, forming a potential double top with a neckline at $78,000. A break below the neckline would project a measured target near $68,200; a close back above $88,000 would invalidate the pattern. Here are the structure, the levels and what would confirm either side.
placeholder
Brent slips from $110 as Russian supply prospects return — is the five-month rally over?Brent crude traded near $108.06 on Monday (-1.71%), pulling back from last week's $110 high after Washington moved to ease restrictions on Russian oil flows. WTI hovered around $101 before dipping below $99. The retreat is real, but so is the supply-risk premium: Hormuz shipping disruptions, attacks on Saudi energy infrastructure and strikes on Russian refineries remain live. Here are the three numbers, the transmission chain and the levels that matter.
Author  Irene Q.
14 hours ago
Brent crude traded near $108.06 on Monday (-1.71%), pulling back from last week's $110 high after Washington moved to ease restrictions on Russian oil flows. WTI hovered around $101 before dipping below $99. The retreat is real, but so is the supply-risk premium: Hormuz shipping disruptions, attacks on Saudi energy infrastructure and strikes on Russian refineries remain live. Here are the three numbers, the transmission chain and the levels that matter.
placeholder
Gold retests $4,200 as dollar and yields retreat — can bullion clear its hardest level?Spot gold traded near $4,175 on Monday (+0.23%), with an intraday high of $4,187.71 after last week's $4,073 ~ $4,217 range; COMEX futures briefly topped $4,200. The dollar slipped to 101.76 and 10-year yields eased from their highs, but October Fed hike odds near 52% and BofA's sub-$4,000 call still cap the upside. Here are the drivers, the levels and what would flip the script.
Author  Irene Q.
14 hours ago
Spot gold traded near $4,175 on Monday (+0.23%), with an intraday high of $4,187.71 after last week's $4,073 ~ $4,217 range; COMEX futures briefly topped $4,200. The dollar slipped to 101.76 and 10-year yields eased from their highs, but October Fed hike odds near 52% and BofA's sub-$4,000 call still cap the upside. Here are the drivers, the levels and what would flip the script.
placeholder
Gold Price Analysis Today | Forex Gold Analysis | XAU/USD Analysis - October 19, 2026Get the latest gold price analysis, forex gold insights, and XAU/USD analysis for October 19, 2026. Read on for the details.
Author  Mitrade
18 hours ago
Get the latest gold price analysis, forex gold insights, and XAU/USD analysis for October 19, 2026. Read on for the details.
goTop
quote