

US September CPI recap: inflation hits 3.7% as core runs hot — is an October Fed hike back on the table?


coverImg
Source: DepositPhotos

Mitrade Insights — It was the print that was supposed to settle the question — and it only sharpened it. US September CPI came in hot across the board on Wednesday: headline inflation 3.7% y/y (3.6% expected), core 2.6% y/y (2.5% expected, 2.4% prior) and core 0.3% m/m — a tenth above consensus. Odds of a hike at the October 27-28 FOMC jumped from about 22% to roughly 37%, peaking near 52% intraday (CME FedWatch, via Reuters and InvestmentNews). And yet the dollar closed lower, gold closed higher, and the S&P 500 fell 1.11%. This is a repricing with a twist — here is the full map.

The numbers that mattered

MetricSeptember actualConsensusAugust
Headline CPI, y/y3.7%3.6%3.4%
Core CPI, y/y2.6%2.5%2.4%
Headline CPI, m/m0.6%0.6%0.4%
Core CPI, m/m0.3%0.2%—

Energy did the headline damage: gasoline rose 9.1% m/m and 34% y/y. The core miss is the one that matters for policy — a third consecutive month of firm core readings removes the "pass-through is fading" argument the Fed's doves have leaned on.

What it does to the Fed

The math is blunt: with core at 0.3% m/m, a hold in October is no longer the default. The October 27-28 meeting is now roughly a one-in-three hike — up from one-in-five before the print (CME FedWatch, via Reuters) — with December pricing also hovering near 50%. The FOMC is genuinely split for the first time since this hiking cycle restarted, and two weeks of data now carry outsized weight.

The repricing: who moved, and who didn't

The dollar couldn't hold it. [CHART] The index spiked on the release but stalled just below the 102.000 line — Wednesday's session high was 101.954 — and ended the day at 101.741, down 0.42%: a down day on hot inflation. That is the tell of a market that was positioned long dollars into the number after October's run above 102.

Yields did. The 10-year Treasury yield spiked to 5.278% intraday before settling back — the long end remains the pressure point behind this entire repricing regime.

Stocks got hit. The S&P 500 fell 1.11% to 7,718.94, with only 196 advancers on the day — the narrowest breadth in weeks — and the Nasdaq slid 1.1% to close below the 27,000 round number (26,692.87).

Gold — the counterintuitive one. Spot dipped to $4,099.89, flirting with this month's lows, then reversed to close at $4,138.25, up 0.82% as the dollar's spike unwound. Gold rising on a hot CPI print is the market saying it trades off the dollar and real yields more than off the inflation headline itself — we map that trade in today's gold piece.
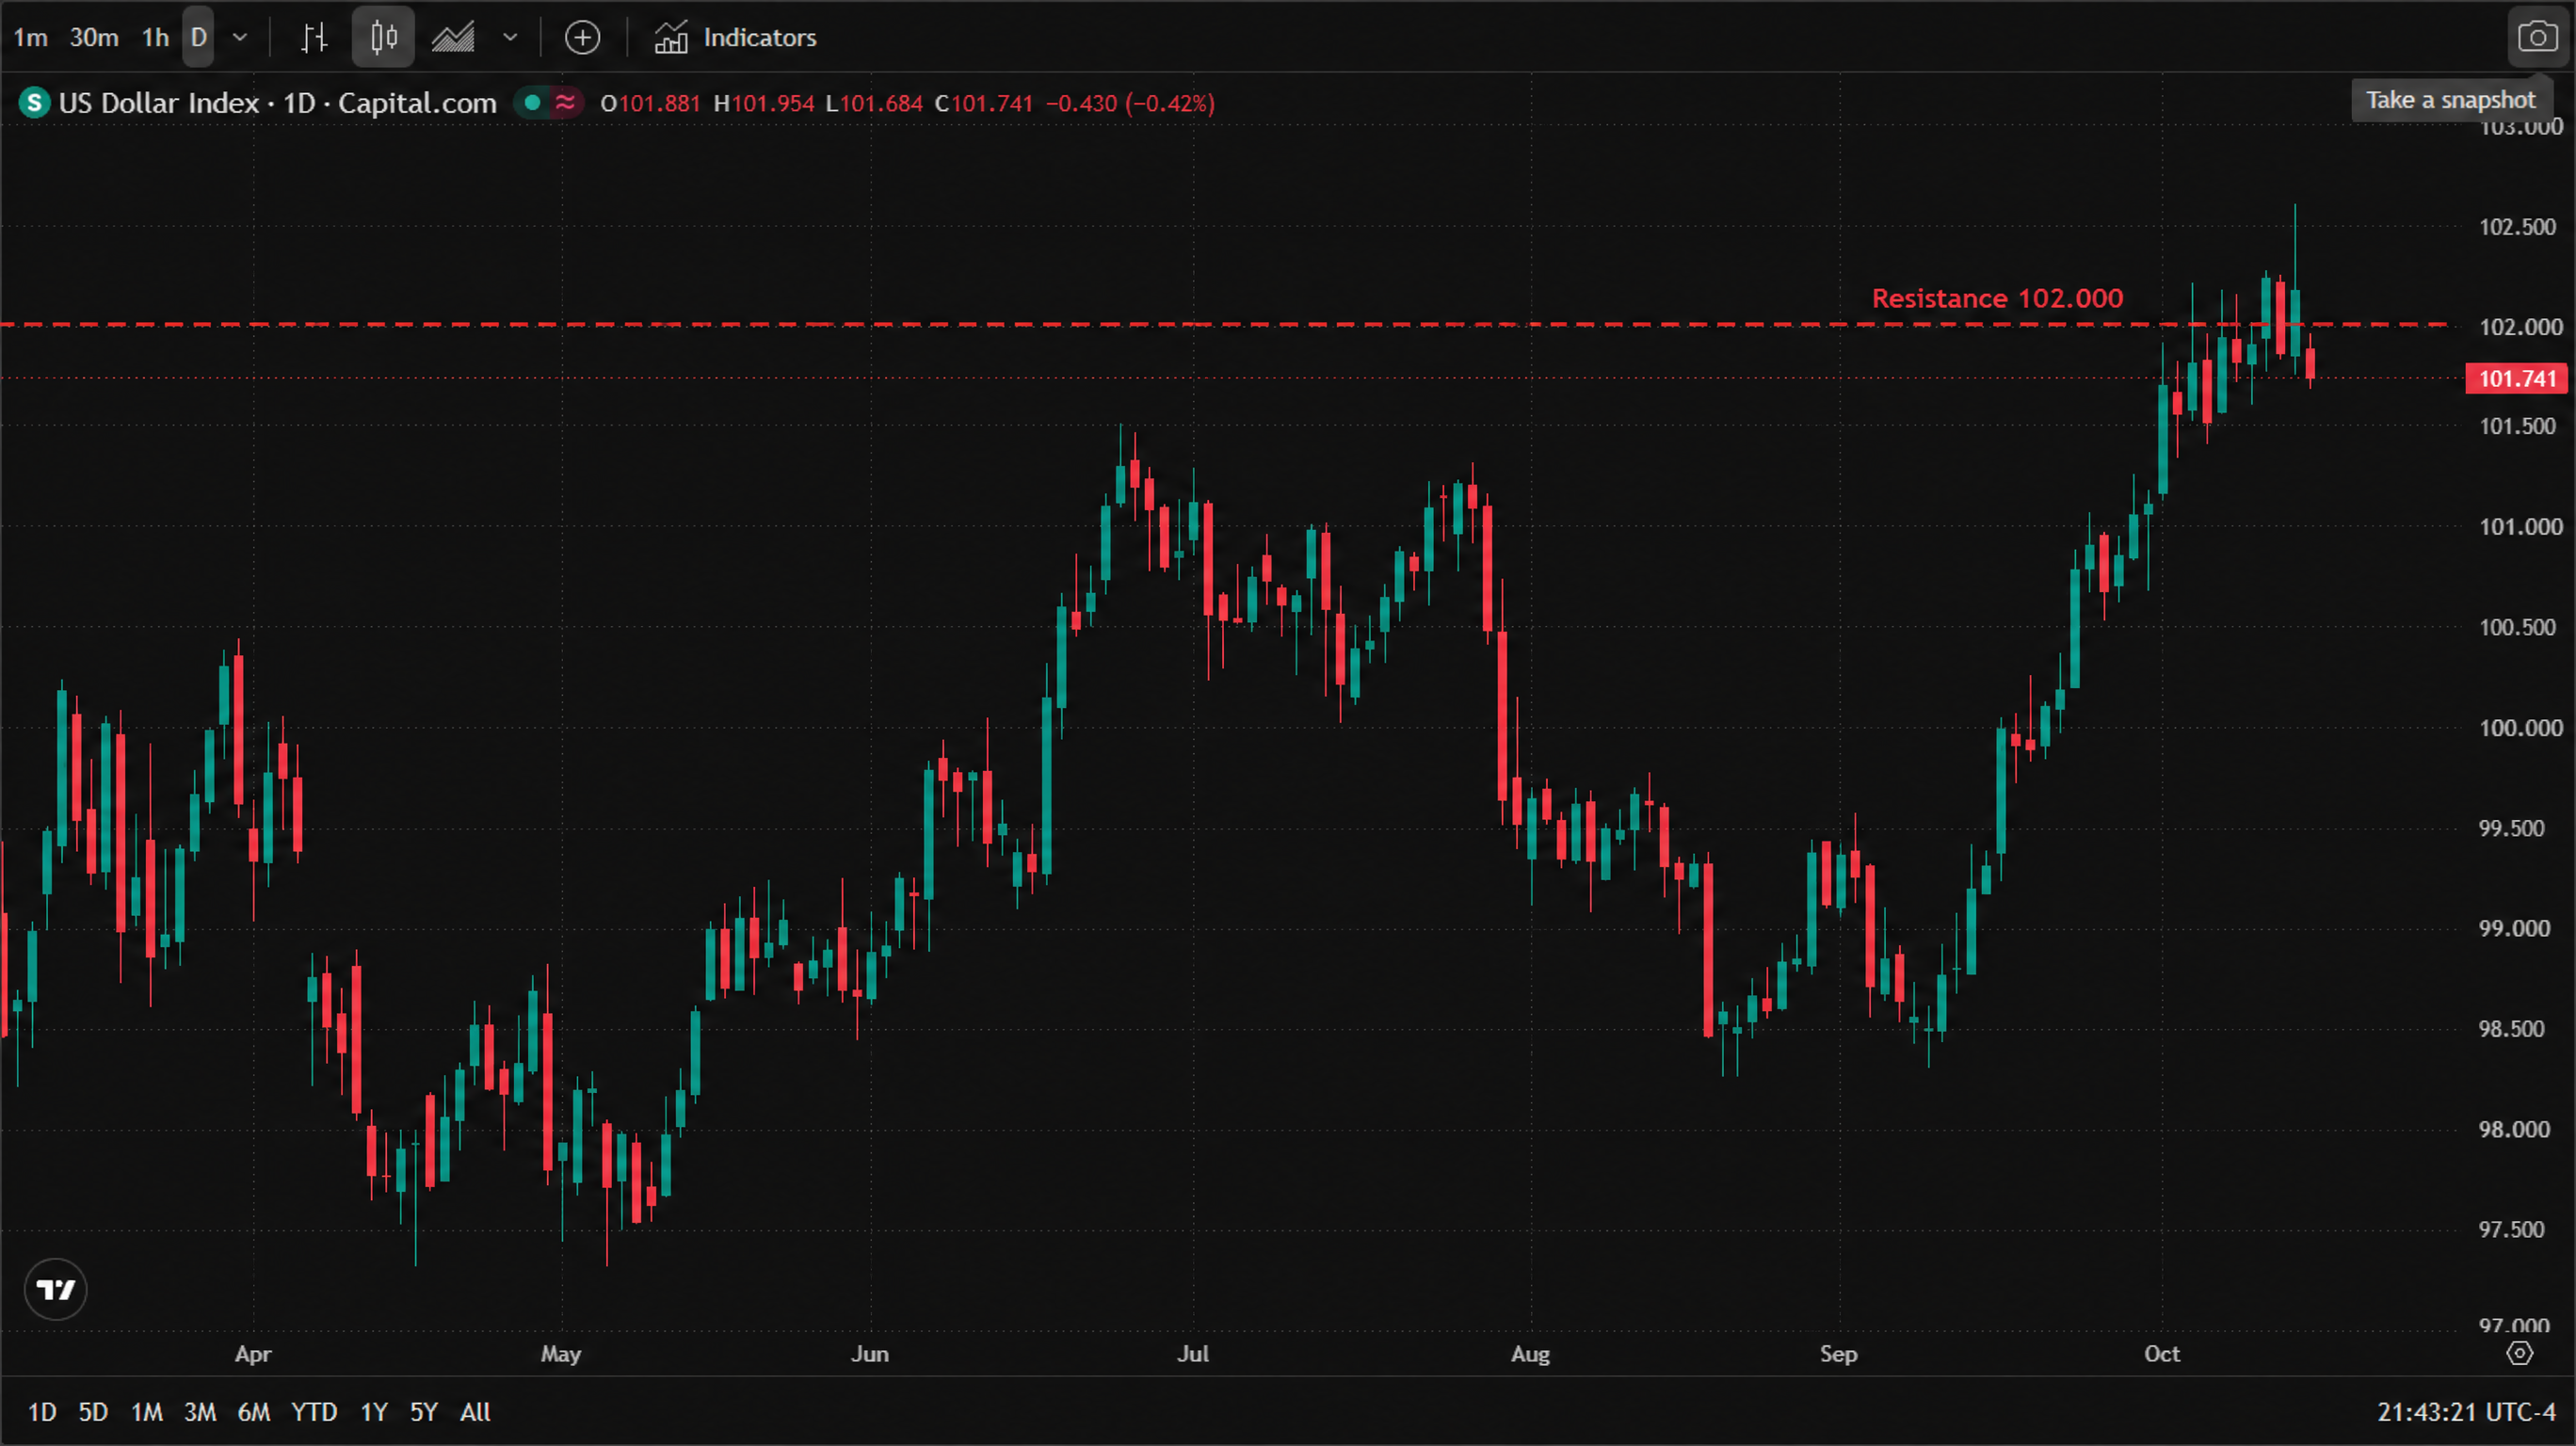
US Dollar Index (Capital.com DXY) daily candlestick chart, April to October 2026: April traded around 99.5–100; May slid to a low near 97.3; June–July recovered into the 101.5–101.7 area; late August pulled back to ~98.4; September began a new rally, with early October peaking near 102.6 before fading; Wednesday closed at 101.741 (−0.42%). A red dashed line marks resistance at the 102.000 level.

* Chart source: TradingView official chart screenshot, data source Capital.com (US Dollar Index).

What to watch

  • Thursday, 8:30 a.m. ET — September PPI and retail sales (0.3% expected). If producer prices echo the CPI upside, the October hike trade hardens fast.

  • October 27-28 — the FOMC decision itself. At ~37% and rising, the Fed's next move is genuinely open for the first time this cycle.

  • The 102.000 line and the long end of the curve. While the dollar stays capped below 102 and yields stop making new highs, the "hot CPI didn't stick" pattern holds — that is the thread the next two weeks will pull.

Read more

  • Gold Price Forecast: Why Did Gold Rebound After September PPI Rose by Most in Nearly Four Years?
  • Note: If you want to share the article 《US September CPI recap: inflation hits 3.7% as core runs hot — is an October Fed hike back on the table?》, make sure you retain the original link. For more information, please visit Insights or browse www.mitrade.com.

    * The content presented above, whether from a third party or not, is considered as general advice only.  This article should not be construed as containing investment advice, investment recommendations, an offer of or solicitation for any transactions in financial instruments.

    goTop
    quote
    Related Articles
    placeholder
    Gold defends $4,100 as BofA targets a break below $4,000 — why the Middle East bid is missingSpot gold flushed to $4,099.89, a whisker above October's $4,090 low, then rebounded to close at $4,138.25 (+0.82%) — even as US CPI ran hot. Bank of America sees gold below $4,000 within three months, citing shrinking demand and official-sector selling. Here are the levels, the drivers and what would flip the script.
    Author  Irene Q.
    Oct 15, Thu
    Spot gold flushed to $4,099.89, a whisker above October's $4,090 low, then rebounded to close at $4,138.25 (+0.82%) — even as US CPI ran hot. Bank of America sees gold below $4,000 within three months, citing shrinking demand and official-sector selling. Here are the levels, the drivers and what would flip the script.
    placeholder
    US September CPI Preview: Inflation May Heat Up, How Will US Stocks, Dollar and Gold React?The U.S. will release its September CPI data on Wednesday (October 14) Eastern Time, which will be one of the most important inflation reports ahead of the Federal Reserve's October 27-28
    Author  TradingKey
    Oct 13, Tue
    The U.S. will release its September CPI data on Wednesday (October 14) Eastern Time, which will be one of the most important inflation reports ahead of the Federal Reserve's October 27-28
    placeholder
    Gold posts first weekly gain in three weeks — can $4,200 hold through CPI?Spot gold closed at $4,194.645, up 1.47% — its first weekly gain in three weeks — and COMEX futures settled back above $4,200 at $4,220.30. Here are the drivers, the levels and the scenarios into Wednesday's CPI.
    Author  Irene Q.
    Oct 10, Sat
    Spot gold closed at $4,194.645, up 1.47% — its first weekly gain in three weeks — and COMEX futures settled back above $4,200 at $4,220.30. Here are the drivers, the levels and the scenarios into Wednesday's CPI.
    placeholder
    United States Dollar Index sits near March 2025 highs, above 102.00 ahead of US NFPThe US Dollar Index (DXY), which tracks the Greenback against a basket of currencies, attracts buyers for the fifth straight day and climbs back above the 102.00 mark during the Asian session on Friday.
    Author  FXStreet
    Oct 02, Fri
    The US Dollar Index (DXY), which tracks the Greenback against a basket of currencies, attracts buyers for the fifth straight day and climbs back above the 102.00 mark during the Asian session on Friday.
    placeholder
    US September Nonfarm Payrolls Preview: Job Growth May Cool, How Will US Stocks, Dollar and Gold React?On Friday, October 2 (EDT), the U.S. will release its September nonfarm payrolls report, with markets focusing on whether job growth can sustain August's rebound and whether the data will
    Author  TradingKey
    Oct 01, Thu
    On Friday, October 2 (EDT), the U.S. will release its September nonfarm payrolls report, with markets focusing on whether job growth can sustain August's rebound and whether the data will
    Live Quotes
    Name / SymbolChart% Change / Price
    USDOLLAR-F
    USDOLLAR-F
    0.00%0.00
    XAUUSD
    XAUUSD
    0.00%0.00

    USD Related Articles

    • Financial Markets 2026: Volatility Catalysts in Gold, Silver, Oil, and Blue-Chip Stocks—A CFD Trader's Outlook
    • Best Currency Pairs To Trade 2026: Guide to Choosing Currency Pairs
    • Trading Chart Patterns:Ultimate Guide to Price Action
    • Australian Dollar Forecast In 2024/2025/2026: Should I Buy AUD/USD Or Other AUD Currency Pairs?
    • AUD/USD holds above 0.6500, eyes on RBA Minutes

    Click to view more