Gold retests $4,200 as dollar and yields retreat — can bullion clear its hardest level?

coverImg
Source: DepositPhotos

Mitrade Insights — Gold is back at the door it has failed to kick open. Spot bullion traded near $4,175 on Monday (+0.23%), with an intraday high of $4,187.71, after last week's $4,073 ~ $4,217 range; COMEX futures briefly topped $4,200 before fading. The immediate tailwind is familiar: the dollar slipped to 101.76 and 10-year Treasury yields eased from their highs. The obstacle is equally familiar: US inflation is still hot, October Fed hike odds sit near 52%, and Bank of America still expects gold below $4,000 within three months. So which side wins at $4,200?

1. The move: a quieter dollar, a stubborn ceiling

Monday's bid is a dollar story first. The US Dollar Index closed Friday at 101.76 (-0.21%), and the 10-year yield held near 5.1% after backing off the prior week's spike. Lower nominal yields, with inflation expectations still elevated, trim the real-yield headwind that has capped gold since September.

But the move is modest, and the reason is simple: the same inflation data that lifted gold also lifted hike odds. US September CPI ran at 3.7% year on year, with core at 2.6%; producer prices accelerated. Markets now assign roughly a 52% probability to a hike at the October 27–28 FOMC meeting — up from about 22% earlier. Gold is climbing a wall of higher rates, not sailing through a vacuum.

2. The bull case and the bear case

The bull caseThe bear case
Middle East shipping and energy-infrastructure risks keep a geopolitical premium in the priceSeptember CPI at 3.7% and accelerating PPI keep the inflation path hot
Central-bank buying remains a structural floor under the marketOctober hike odds near 52%; 10-year yields still above 5%
The dollar has rolled over from its highs and real yields are easing$4,200 has rejected price repeatedly; the level is now a clear technical ceiling
The $4,073 October low has held, keeping the range intactWGC data shows Turkey (-82t) and Russia (-56t) sold through August — official demand is not one-way

The bull case is about the floor; the bear case is about the ceiling. Neither has decisively won, which is exactly why gold has spent two weeks boxed between $4,073 and $4,200.

3. The levels that matter
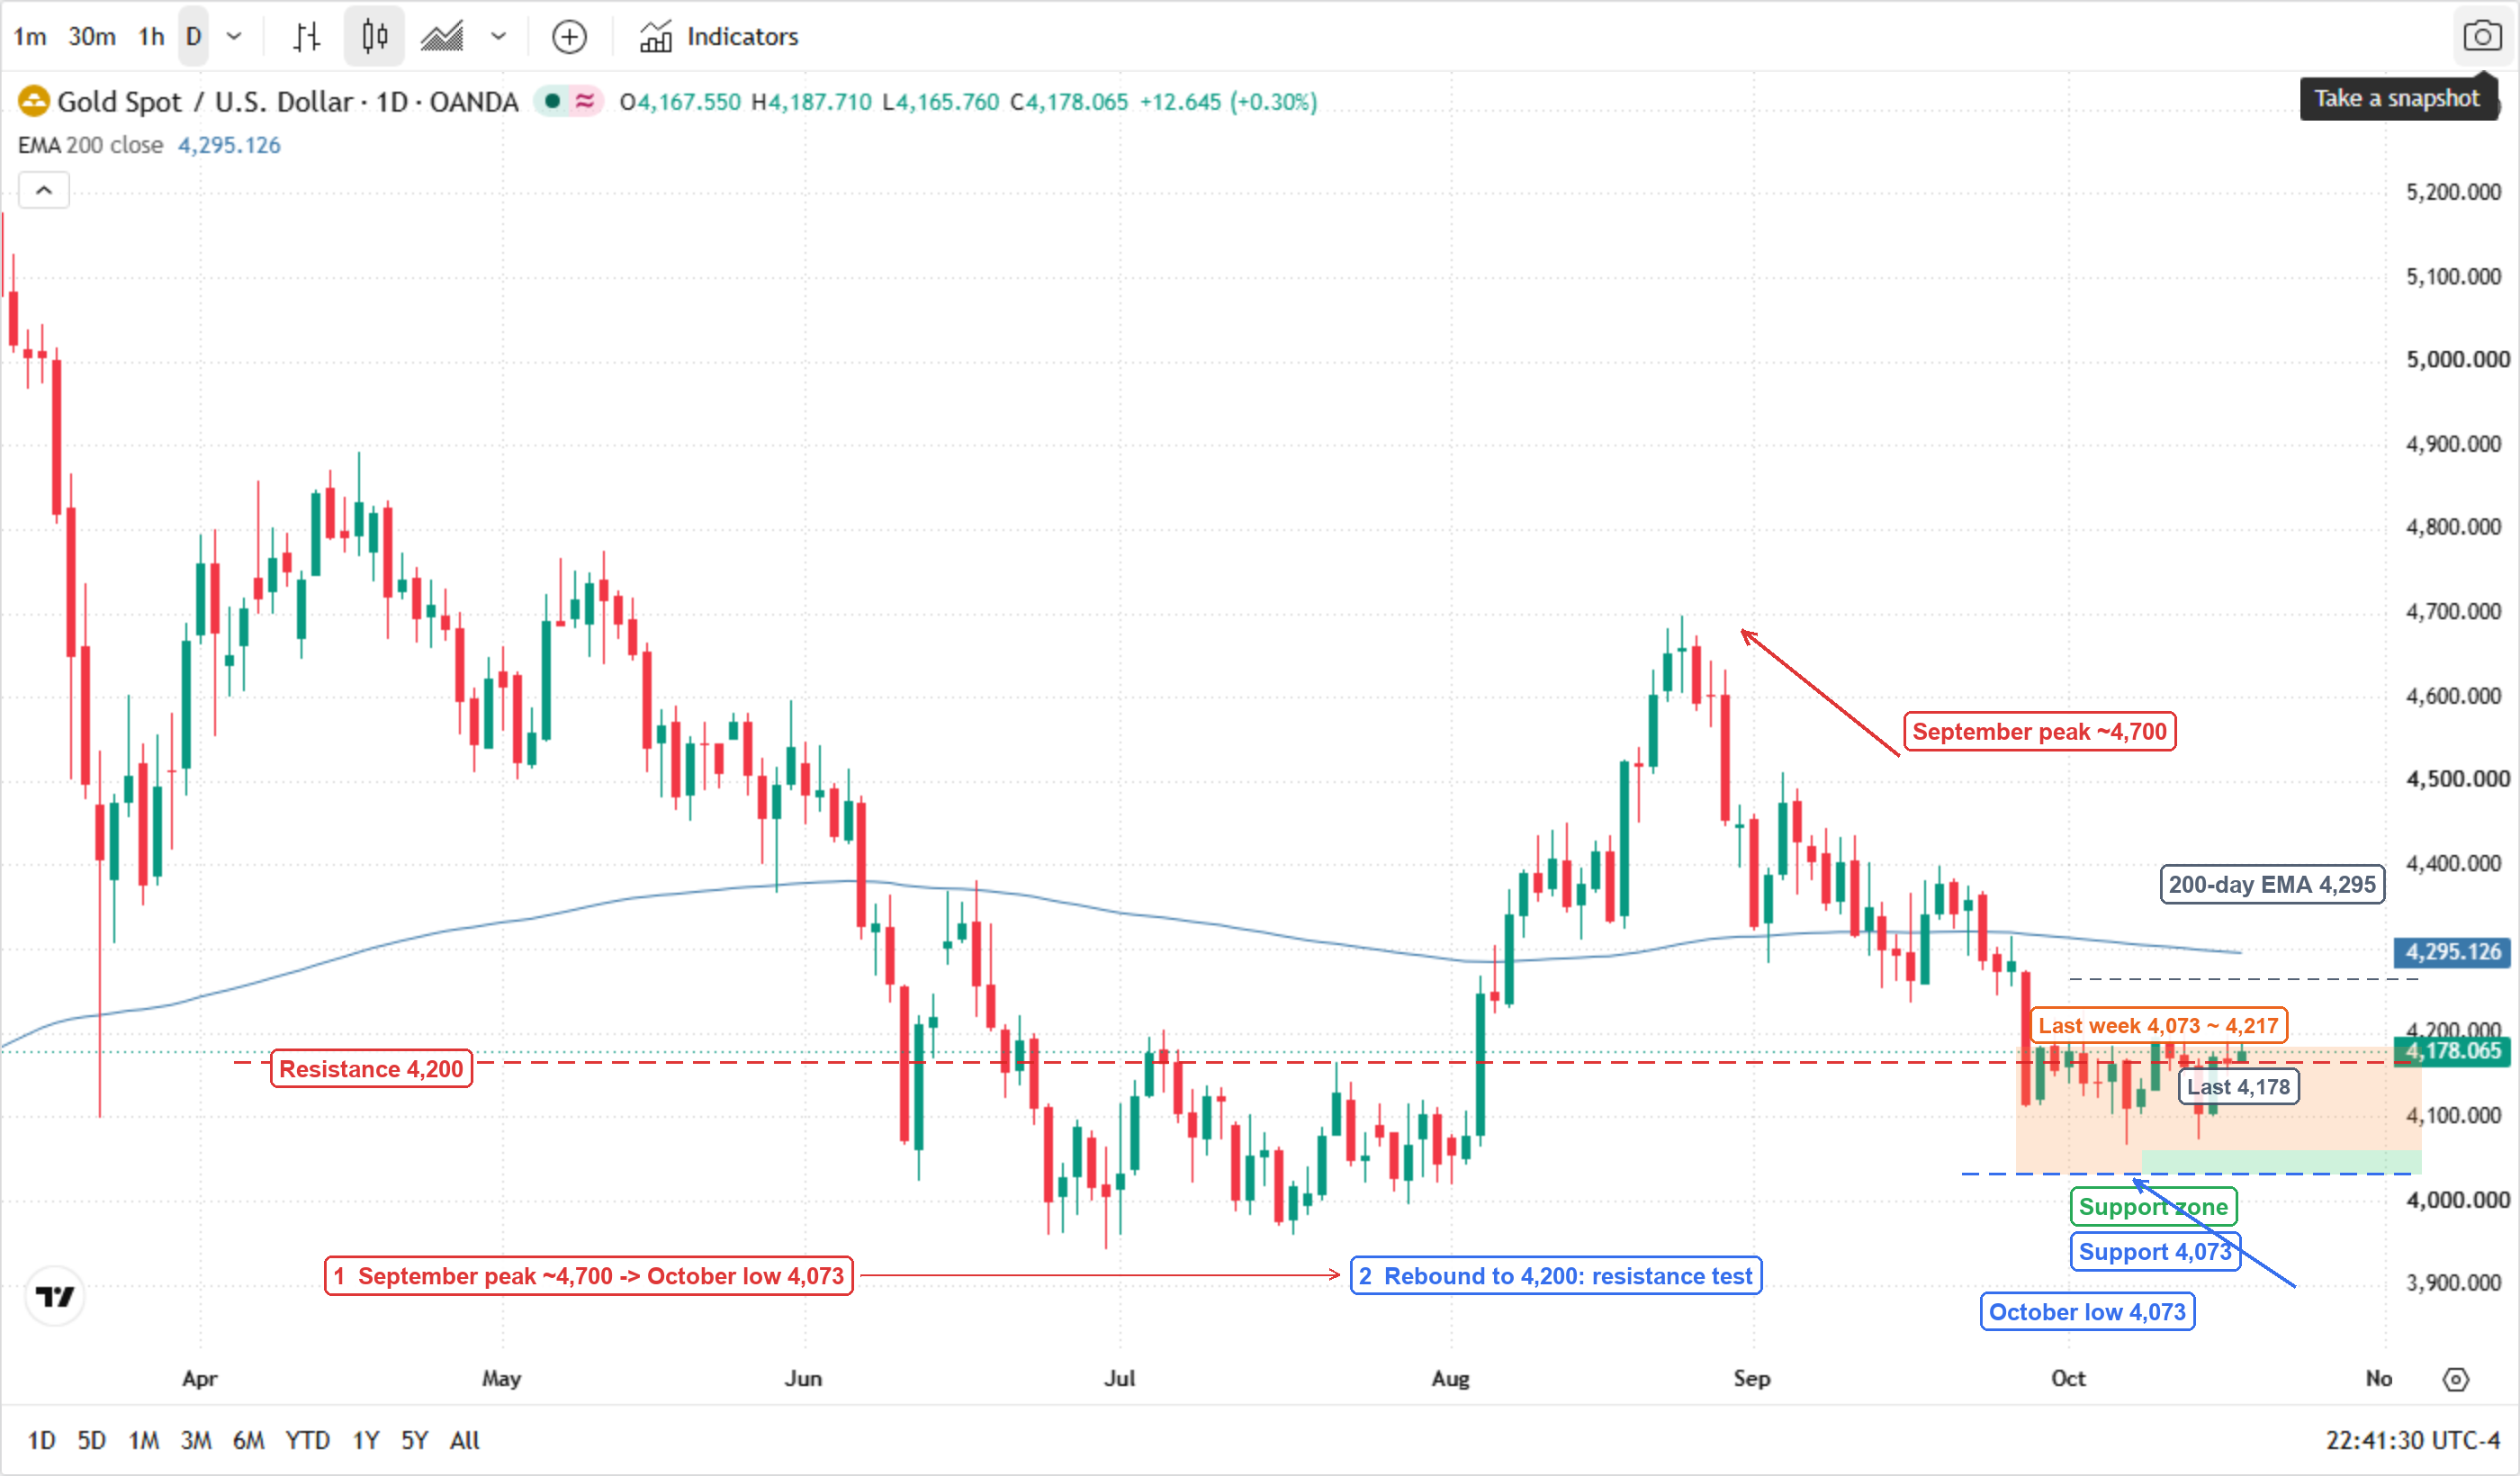
Gold Spot / U.S. Dollar (OANDA) daily candlestick chart with the 200-day EMA, April to November 2026: April highs faded from near 5,000; May slid into the 4,400s; June based near 3,950; August rallied back above 4,500; early September peaked around 4,700 before a sustained slide into October's 4,073 low; Monday's rebound put spot near 4,175, still below the 200-day EMA at 4,295.097. The chart is annotated with a red resistance line at 4,200, a blue support line at 4,073, a grey 200-day EMA line at 4,295, an orange band marking last week's 4,073 ~ 4,217 range, a green support zone at 4,073 ~ 4,100, arrows marking the September peak near 4,700 and the October low at 4,073, and two numbered flow boxes summarising the pullback and the rebound test.

* Chart source: TradingView official chart screenshot, data source OANDA (spot gold / XAUUSD).

Watch $4,200 first: a daily close above it would turn the ceiling into support and open the 200-day EMA at $4,295.097 — the line that has capped every rebound since September. Below, $4,073 is the October floor and the bottom of last week's range; a break there exposes the $4,000 psychological zone and BofA's $3,950 reference.

4. What would flip the script

  • A daily close above $4,200. The first evidence that the two-week ceiling is breaking rather than holding; the 200-day EMA at $4,295 becomes the next test.

  • A daily close below $4,073. The range breaks downward and the $4,000 zone — where BofA sees the next stop — comes into play.

  • A sustained drop in the dollar below 101. Every durable gold rally this year has started with a softer dollar and lower long-end yields; a one-day dip has not been enough.

  • The next World Gold Council update showing official-sector flows turning net-positive. If central banks resume buying in size, the structural floor under the bear case gets thicker.

Bottom line: gold is doing two things at once — pricing a geopolitical premium, and paying for it with a higher real-yield discount. Until $4,200 or $4,073 breaks on a daily close, the market is paying traders to wait, not to chase.
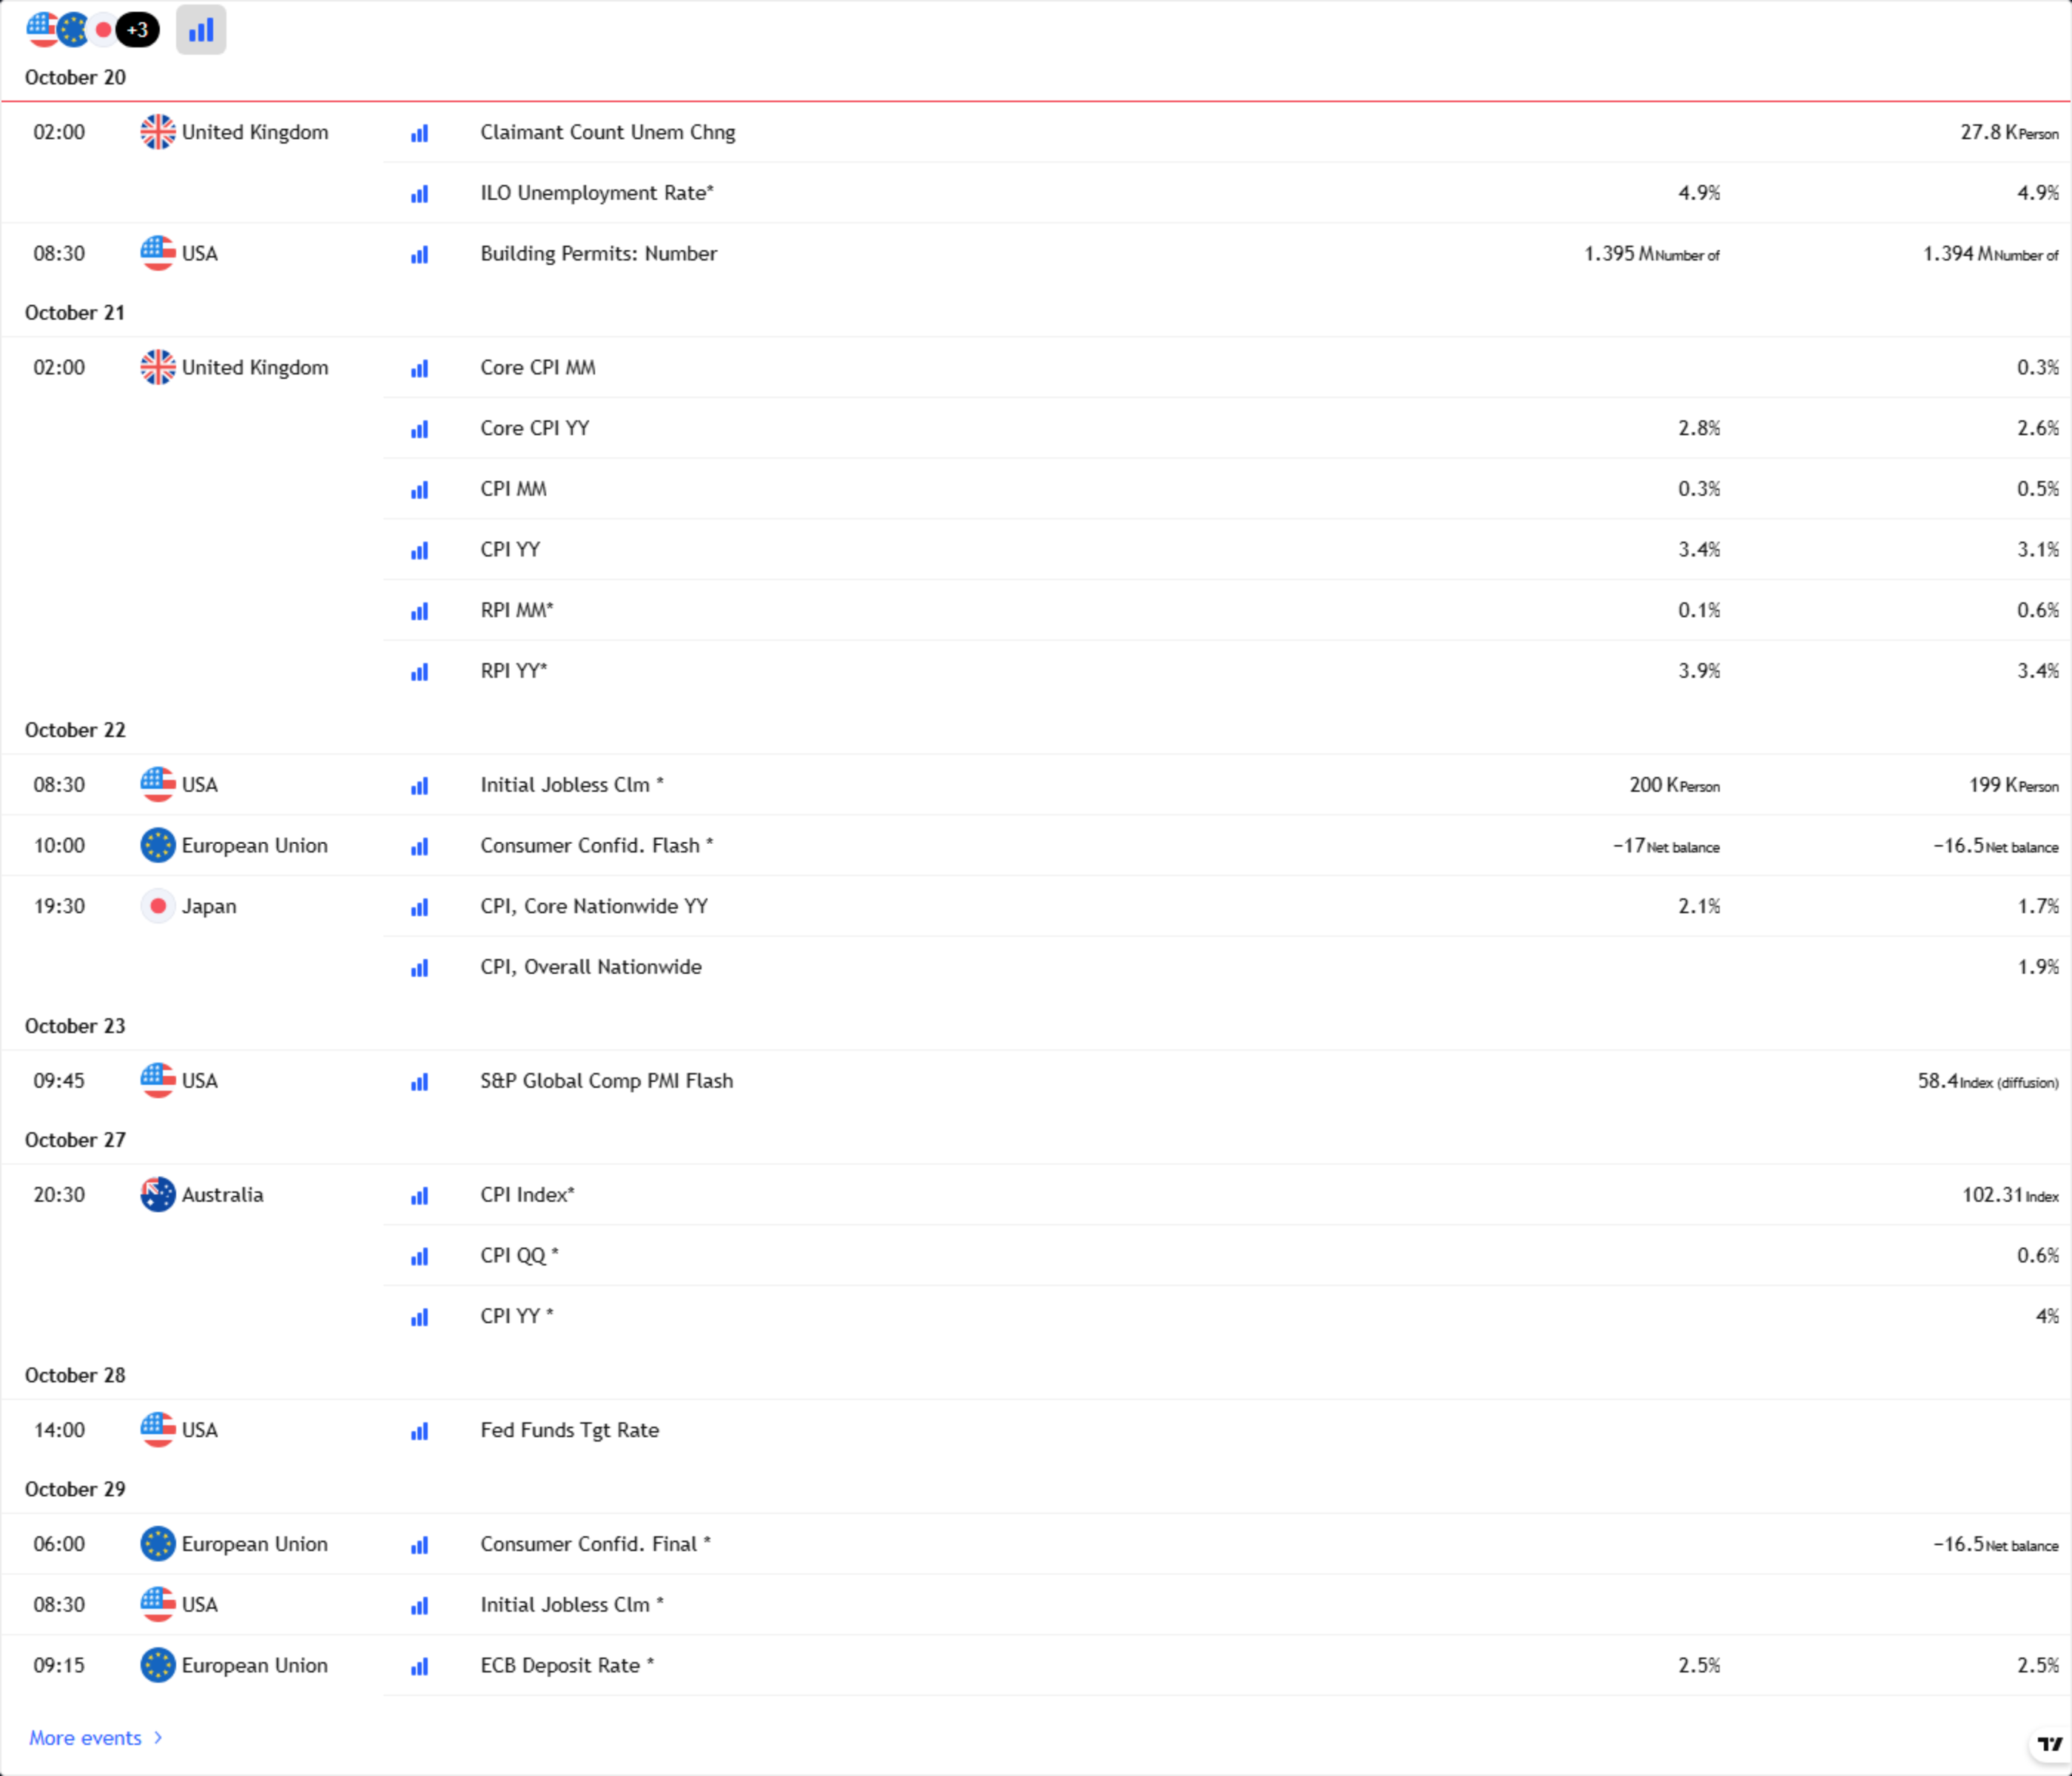
TradingView economic calendar screenshot (New York time, week starting October 19, 2026): high-importance events for the US, euro area, Japan, China, the UK and Australia, including China's Q3 GDP, UK CPI, US initial jobless claims and Japan's national CPI, with release times and consensus figures.

* Chart source: TradingView official economic calendar widget screenshot.

Related reads: Gold defends $4,100 as BofA targets a break below $4,000 — why the Middle East bid is missing

Read more

  • Gold Price Forecast: Gold Tumbles Below $3,900 as Trump Says No Need for Iran Deal; Can October PPI Spur a Rebound?
  • Today’s Market Recap: Nvidia Drops Over 4% After Jensen Huang Resigns, AMD and Broadcom Both Rise Over 5%
  • Gold hit a one-year low while central banks bought 321 tonnes — the sellers were never the ones you think
  • Note: If you want to share the article 《Gold retests $4,200 as dollar and yields retreat — can bullion clear its hardest level?》, make sure you retain the original link. For more information, please visit Insights or browse www.mitrade.com.


    Before making any trading decisions, it is important to equip yourself with sufficient fundamental knowledge, have a comprehensive understanding of market trends, be aware of risks and hidden costs, carefully consider investment targets, level of experience, risk appetite, and seek professional advice if necessary.


    Furthermore, the content of this article is solely the author's personal opinion and does not necessarily constitute investment advice. The content of this article is for reference purposes only, and readers should not use this article as a basis for any investment decisions.


    Investors should not rely on this information as a substitute for independent judgment or make decisions solely based on this information. It does not constitute any trading activity and does not guarantee any profits in trading.


    If you have any inquiries regarding the data, information, or content related to Mitrade in this article, please contact us via email: insights@mitrade.com. The Mitrade team will carefully review the content to continue improving the quality of the article.


    goTop
    quote
    Related Articles
    placeholder
    Weekly Report: DXY 103.41, 10-year 5.15%, AUD carry 3bp — three FX regimes flipped in one weekThe dollar index rose 1.09% to 103.41, a 19-month high, while the US 10-year closed at 5.154% and the Australia-US two-year spread collapsed to about 3 basis points from 36. EURUSD fell 1.59% to 1.1024, USDJPY rose 1.51% to 159.78 and AUDUSD fell 1.79% to 0.6764, a 10-month low. Three FX regimes — the broad dollar, the US rate level and the Australian carry premium — flipped in the same week. This report marks the thresholds, ranks which one can flip back first, and lists the week's calendar.
    Author  Irene Q.
    4 hours ago
    The dollar index rose 1.09% to 103.41, a 19-month high, while the US 10-year closed at 5.154% and the Australia-US two-year spread collapsed to about 3 basis points from 36. EURUSD fell 1.59% to 1.1024, USDJPY rose 1.51% to 159.78 and AUDUSD fell 1.79% to 0.6764, a 10-month low. Three FX regimes — the broad dollar, the US rate level and the Australian carry premium — flipped in the same week. This report marks the thresholds, ranks which one can flip back first, and lists the week's calendar.
    placeholder
    US October PPI Preview: Fed Rate Hike Expectations Rise, PPI May Be Key Variable; How Will US Stocks, Dollar, and Gold Move?On Friday (Nov. 13) Eastern Time, the U.S. will release the October Producer Price Index (PPI). Following the October CPI once again exceeding expectations, the market will look to the PP
    Author  TradingKey
    Nov 12, Thu
    On Friday (Nov. 13) Eastern Time, the U.S. will release the October Producer Price Index (PPI). Following the October CPI once again exceeding expectations, the market will look to the PP
    placeholder
    US October CPI Preview: Inflation Growth May Slow, How Will US Stocks, Dollar and Gold React? On Tuesday (Nov. 10) Eastern Time, the U.S. will release the October Consumer Price Index (CPI), a key inflation reading ahead of the Federal Reserve's December interest rate decision. Th
    Author  TradingKey
    Nov 09, Mon
    On Tuesday (Nov. 10) Eastern Time, the U.S. will release the October Consumer Price Index (CPI), a key inflation reading ahead of the Federal Reserve's December interest rate decision. Th
    placeholder
    Weekly Report: The dollar rose and the euro rose with it — three FX divergences, one should convergeDXY added 0.41% last week and EURUSD added 0.41% in the same five sessions, despite a 60-day correlation of -0.73. AUDUSD fell 1.36% after the RBA's sixth hike of the year, and USDJPY barely moved 0.19% even as markets priced a December BOJ hike. Three divergences, one of which the mechanism forces to close.
    Author  Irene Q.
    Nov 09, Mon
    DXY added 0.41% last week and EURUSD added 0.41% in the same five sessions, despite a 60-day correlation of -0.73. AUDUSD fell 1.36% after the RBA's sixth hike of the year, and USDJPY barely moved 0.19% even as markets priced a December BOJ hike. Three divergences, one of which the mechanism forces to close.
    placeholder
    Breaking: US Dollar falls below 101.50 as early midterm results point to Democratic gainsUS Dollar Index (DXY) faces some selling pressure near 101.25 during the early Asian session on Wednesday. Traders will closely monitor the US midterm election outcomes later in the day for fresh impetus.
    Author  FXStreet
    Nov 04, Wed
    US Dollar Index (DXY) faces some selling pressure near 101.25 during the early Asian session on Wednesday. Traders will closely monitor the US midterm election outcomes later in the day for fresh impetus.
    Live Quotes
    Name / SymbolChart% Change / Price
    XAUUSD
    XAUUSD
    0.00%0.00
    XAGUSD
    XAGUSD
    0.00%0.00

    USD Related Articles

    • Financial Markets 2026: Volatility Catalysts in Gold, Silver, Oil, and Blue-Chip Stocks—A CFD Trader's Outlook
    • Best Currency Pairs To Trade 2026: Guide to Choosing Currency Pairs
    • Trading Chart Patterns:Ultimate Guide to Price Action
    • Australian Dollar Forecast In 2024/2025/2026: Should I Buy AUD/USD Or Other AUD Currency Pairs?
    • AUD/USD holds above 0.6500, eyes on RBA Minutes

    Click to view more