

GBP/JPY Price Forecast: Trendline breakout puts 213.00 in sight

Source Fxstreet
  • GBP/JPY rallies for third consecutive day after breaking descending trendline.
  • Buyers target 211.28 and 50-day SMA at 211.57 next.
  • Break above 212.00 exposes 200-day SMA at 213.00 and 213.50.

The GBP/JPY advances by some 0.16% and extends its rally for the third straight day, with the cross pair trading at 210.93 as it approaches the September 18 high of 211.28, seen as the next key resistance ahead of the 50-day Simple Moving Average (SMA).

GBP/JPY Price Forecast: Technical outlook

Although the cross-pair seems to be gaining traction, a break of key resistance levels is needed for GBP/JPY buyers to retest mid-July or August levels in the 217.40-219.50 area before US and Japanese authorities intervene in the FX markets.

After clearing a downslope resistance trendline drawn from the September 18 highs, the GBP/JPY rallied 140 pips, exposing the 211.00 figure as the next area of interest. Should buyers reclaim the latter, a move to the 50-day SMA at 211.57 is on the cards. This could put into play a test of the 212.00 mark, ahead of the 200-day SMA at 213.00, followed by the 100-day SMA at 213.50.

A bearish scenario resumes if GBP/JPY tumbles back below a downward resistance trendline, near 209.30. Beneath this area emerges the October 8 swing low of 208.20, followed by the September 30 cycle low of 206.89.

GBP/JPY Price Chart – Daily
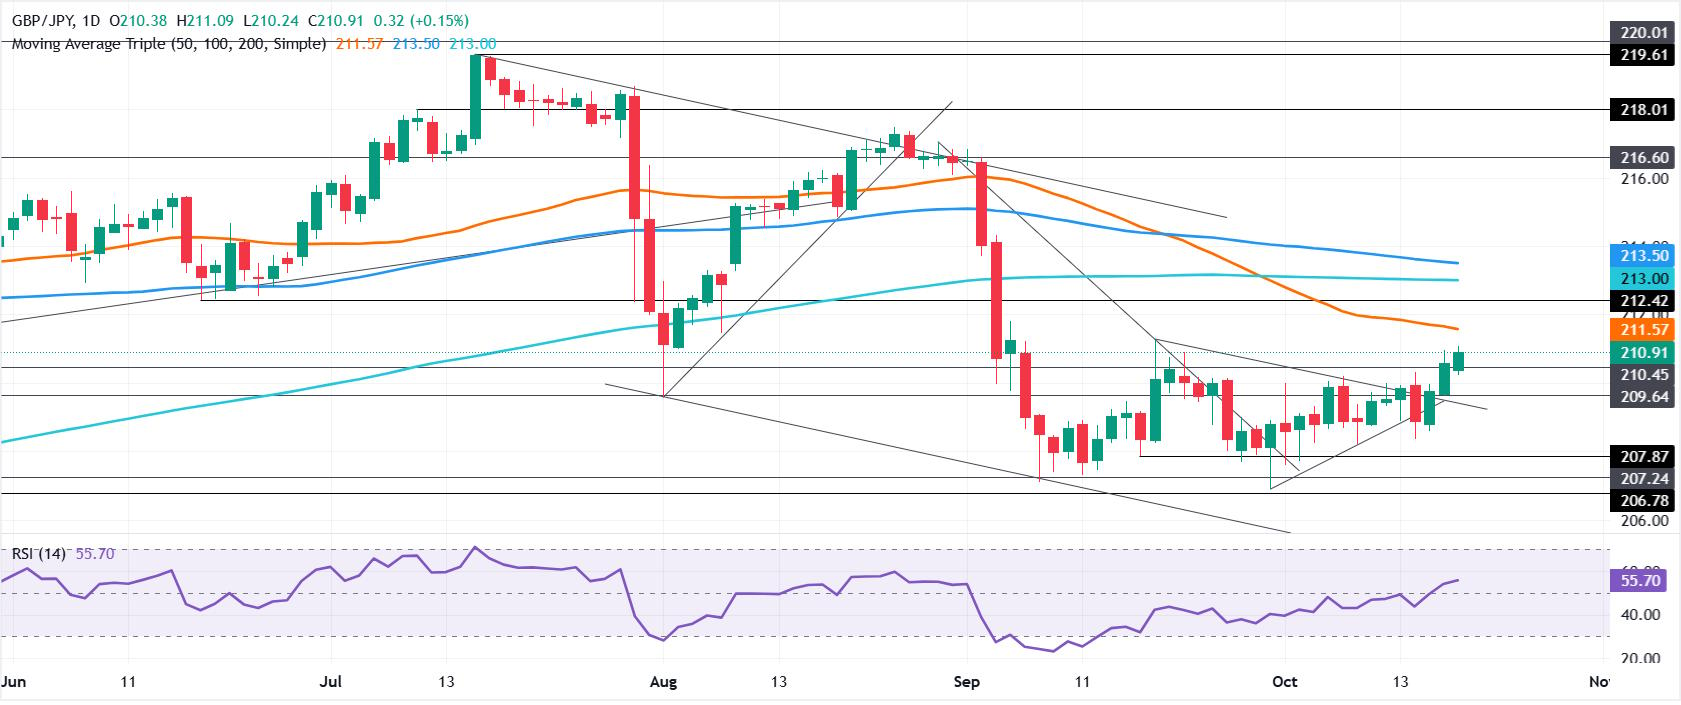
GBP/JPY daily chart


Japanese Yen Price Today

The table below shows the percentage change of Japanese Yen (JPY) against listed major currencies today. Japanese Yen was the strongest against the Swiss Franc.

USD EUR GBP JPY CAD AUD NZD CHF
USD 0.24% 0.19% 0.33% -0.21% -0.48% -0.16% 0.32%
EUR -0.24% -0.06% 0.11% -0.45% -0.72% -0.42% 0.08%
GBP -0.19% 0.06% 0.15% -0.39% -0.68% -0.35% 0.13%
JPY -0.33% -0.11% -0.15% -0.52% -0.89% -0.48% 0.01%
CAD 0.21% 0.45% 0.39% 0.52% -0.26% 0.04% 0.54%
AUD 0.48% 0.72% 0.68% 0.89% 0.26% 0.32% 0.83%
NZD 0.16% 0.42% 0.35% 0.48% -0.04% -0.32% 0.49%
CHF -0.32% -0.08% -0.13% -0.01% -0.54% -0.83% -0.49%

The heat map shows percentage changes of major currencies against each other. The base currency is picked from the left column, while the quote currency is picked from the top row. For example, if you pick the Japanese Yen from the left column and move along the horizontal line to the US Dollar, the percentage change displayed in the box will represent JPY (base)/USD (quote).

Disclaimer: For information purposes only. Past performance is not indicative of future results.
placeholder
Gold Price Analysis Today | Forex Gold Analysis | XAU/USD Analysis - October 16, 2026Get the latest gold price analysis, forex gold insights, and XAU/USD analysis for October 16, 2026. Read on for the details.
Author  Mitrade
Oct 16, Fri
Get the latest gold price analysis, forex gold insights, and XAU/USD analysis for October 16, 2026. Read on for the details.
placeholder
WTI drops to near $97.50 as US waives Russia oil sanctionsWest Texas Intermediate (WTI) oil price declines after seven days of gains, trading around 97.40 per barrel during Asian hours on Monday.
Author  FXStreet
Yesterday 01: 21
West Texas Intermediate (WTI) oil price declines after seven days of gains, trading around 97.40 per barrel during Asian hours on Monday.
placeholder
Gold Price Analysis Today | Forex Gold Analysis | XAU/USD Analysis - October 19, 2026Get the latest gold price analysis, forex gold insights, and XAU/USD analysis for October 19, 2026. Read on for the details.
Author  Mitrade
23 hours ago
Get the latest gold price analysis, forex gold insights, and XAU/USD analysis for October 19, 2026. Read on for the details.
placeholder
Gold retests $4,200 as dollar and yields retreat — can bullion clear its hardest level?Spot gold traded near $4,175 on Monday (+0.23%), with an intraday high of $4,187.71 after last week's $4,073 ~ $4,217 range; COMEX futures briefly topped $4,200. The dollar slipped to 101.76 and 10-year yields eased from their highs, but October Fed hike odds near 52% and BofA's sub-$4,000 call still cap the upside. Here are the drivers, the levels and what would flip the script.
Author  Irene Q.
19 hours ago
Spot gold traded near $4,175 on Monday (+0.23%), with an intraday high of $4,187.71 after last week's $4,073 ~ $4,217 range; COMEX futures briefly topped $4,200. The dollar slipped to 101.76 and 10-year yields eased from their highs, but October Fed hike odds near 52% and BofA's sub-$4,000 call still cap the upside. Here are the drivers, the levels and what would flip the script.
placeholder
Brent slips from $110 as Russian supply prospects return — is the five-month rally over?Brent crude traded near $108.06 on Monday (-1.71%), pulling back from last week's $110 high after Washington moved to ease restrictions on Russian oil flows. WTI hovered around $101 before dipping below $99. The retreat is real, but so is the supply-risk premium: Hormuz shipping disruptions, attacks on Saudi energy infrastructure and strikes on Russian refineries remain live. Here are the three numbers, the transmission chain and the levels that matter.
Author  Irene Q.
19 hours ago
Brent crude traded near $108.06 on Monday (-1.71%), pulling back from last week's $110 high after Washington moved to ease restrictions on Russian oil flows. WTI hovered around $101 before dipping below $99. The retreat is real, but so is the supply-risk premium: Hormuz shipping disruptions, attacks on Saudi energy infrastructure and strikes on Russian refineries remain live. Here are the three numbers, the transmission chain and the levels that matter.
Related Instrument
goTop
quote