

Worldcoin (WLD) Price Could Surge 37% If This Happens
The Worldcoin (WLD) price has surged 25.08% over the last week, but most holders are still facing losses. About 65% of investors bought at prices higher than the recent increase, leaving only a quarter of holders profitable. The Historical Break Even Price chart shows that many holders are still underwater, which could make them reluctant to sell, anticipating further gains.
This scenario could limit selling pressure, potentially creating a more favorable price outlook for WLD. However, technical indicators like the BBTrend suggest that bullish momentum may be weakening, indicating the possibility of a trend reversal.
The Majority of WLD Holders Are Still Facing Losses
Despite WLD’s 25.08% price increase over the last seven days, around 65% of holders are still facing losses. This suggests that the majority of WLD investors acquired their tokens at prices higher than the recent surge.
The Historical Break Even Price chart provides valuable insight into this, displaying where most holders purchased and indicating whether they are in profit, at break-even, or in loss. At present, only 25% of holders are profitable, while about 10% are breaking even, leaving a significant portion still in the red.
Read more: 5 Best Worldcoin (WLD) Wallets in 2024
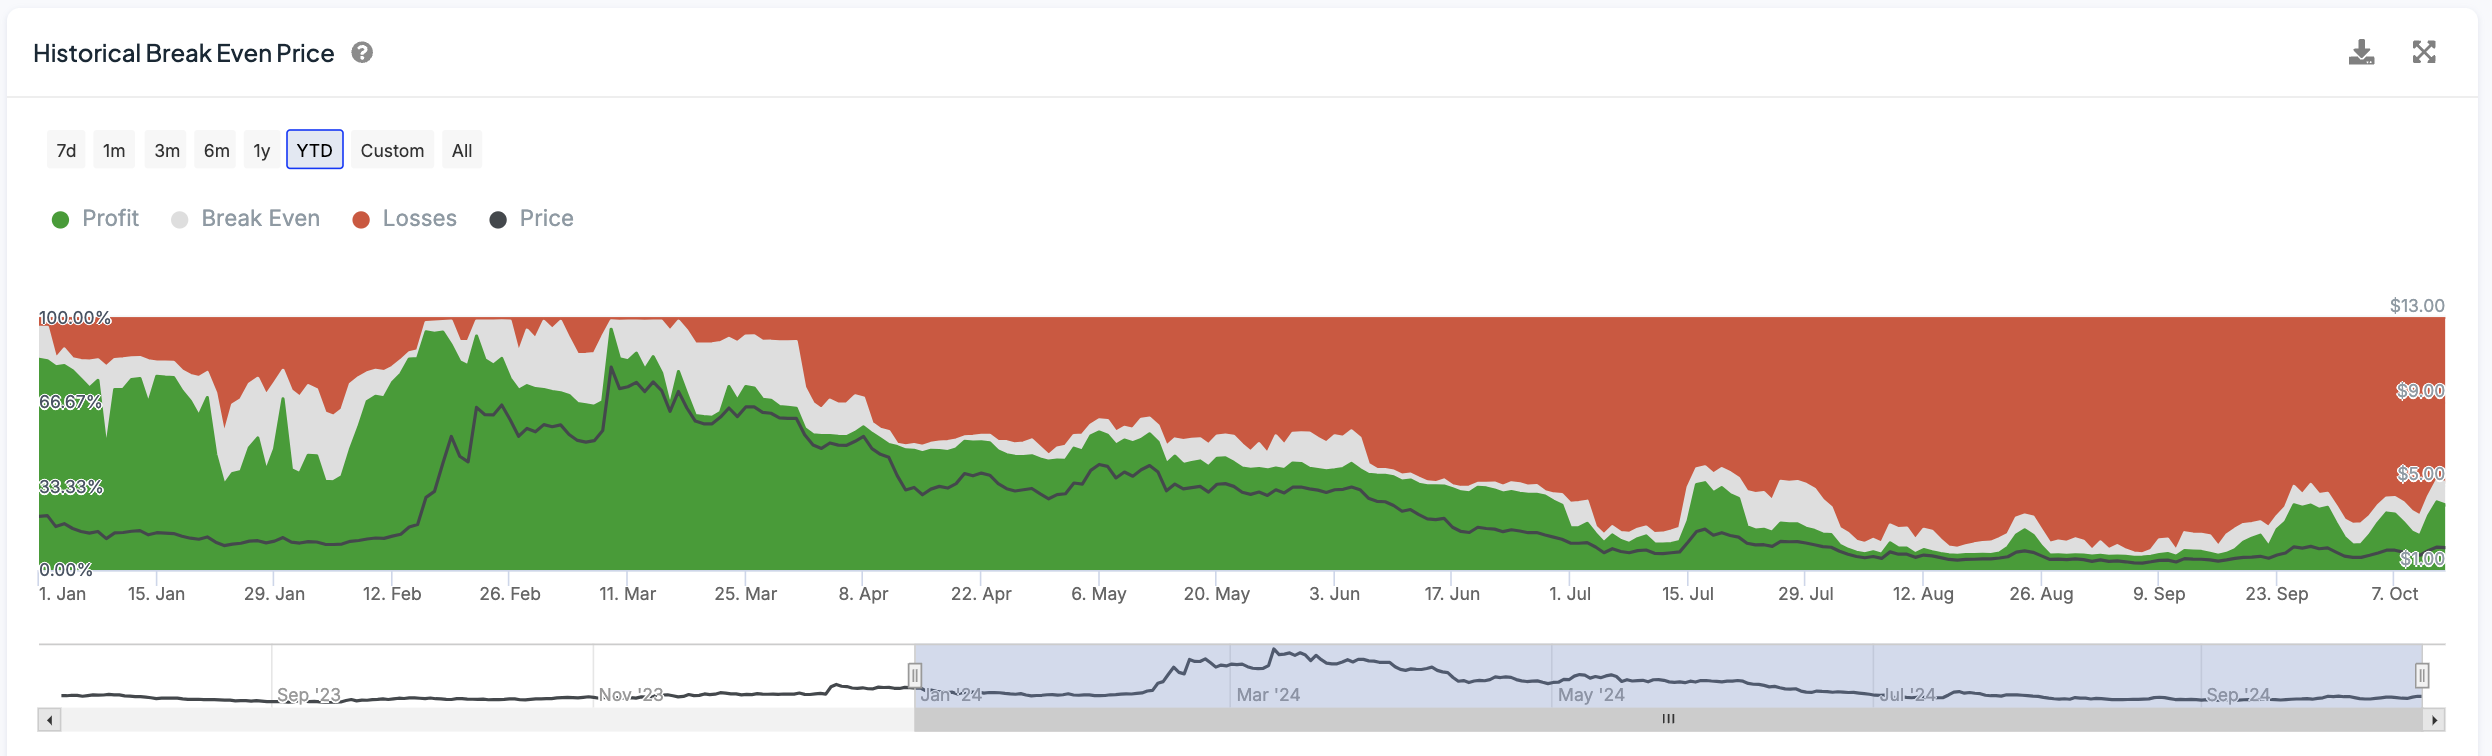 WLD Historical Break Even Price. Source: IntoTheBlock
This scenario suggests that many of those currently at a loss may be unwilling to sell, anticipating further price gains. If this mindset continues, it could reduce the likelihood of a substantial sell-off, easing selling pressure.
This could foster a more favorable outlook for WLD price, where limited selling combined with stable or rising demand could drive prices higher.
Worldcoin BBTrend Shows The Uptrend Could Be Fading Away
The BBTrend indicator currently shows a value of -0.5, which suggests that the momentum in the WLD price is weakening, and it may be shifting toward bearish territory. BBTrend, or Bollinger Bands Trend, is a technical indicator used to assess the strength and direction of a trend by measuring how far the price moves relative to the Bollinger Bands.
Positive values indicate an uptrend, while negative values reflect a downtrend, with larger absolute numbers representing stronger trends.
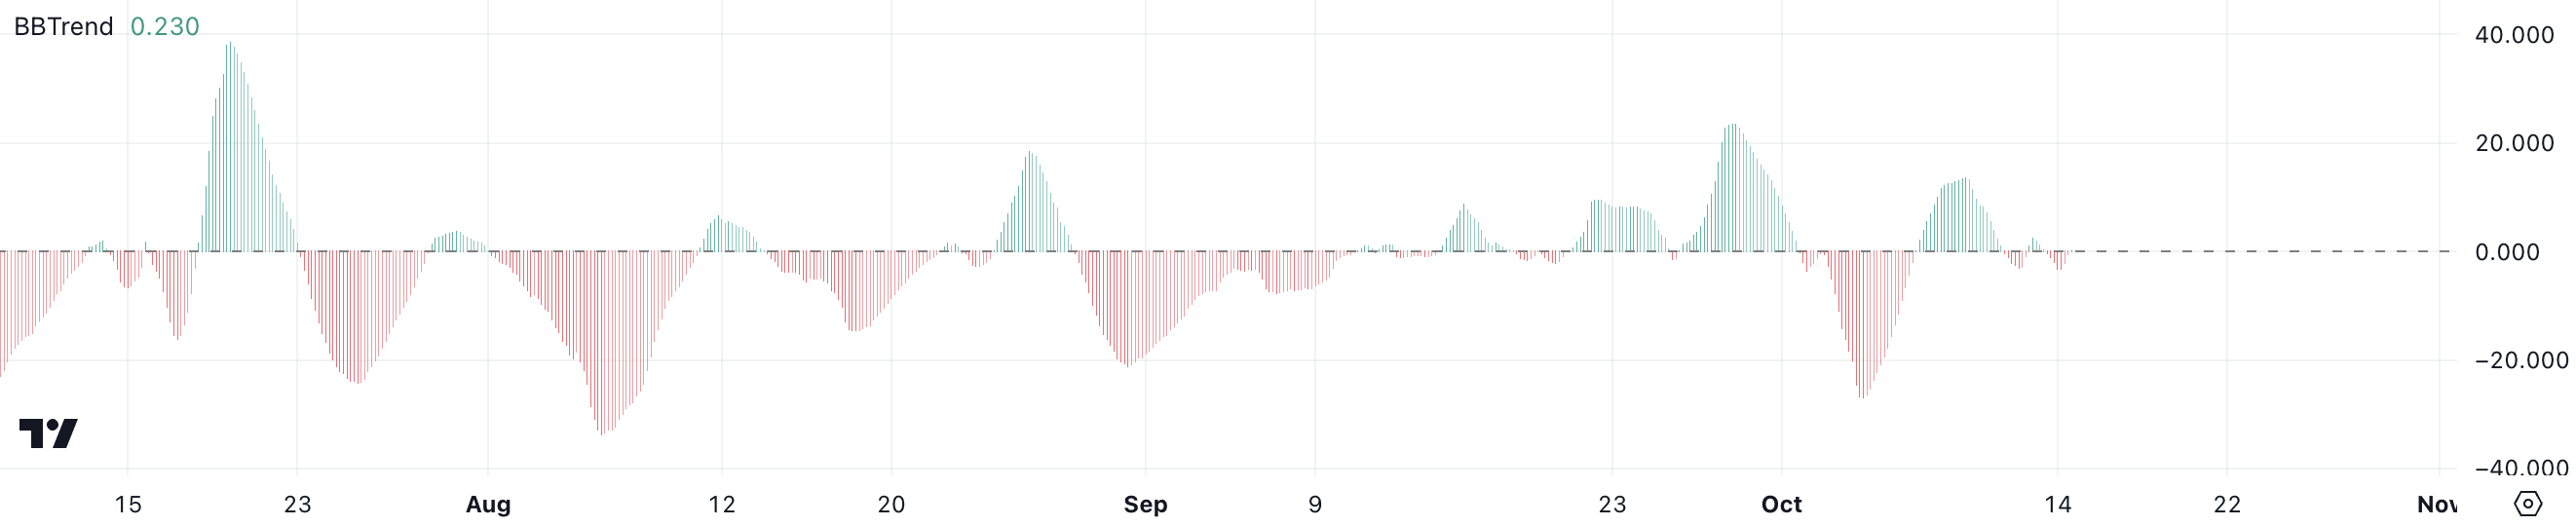 WLD BBTrend. Source: TradingView
Although WLD has been in a strong uptrend, this chart indicates that the bullish momentum may be fading. On October 9, the BBTrend peaked at 14, reflecting strong buying pressure, but since October 11, the values have dropped sharply, remaining below 2.5, and now even turning negative.
This suggests that the strength of the uptrend is waning, and there may be a potential reversal or further consolidation ahead. The diminished BBTrend reading is a sign that the market may have overextended, and the uptrend could be losing steam.
WLD Price Prediction: Will The Uptrend Continue?
WLD currently appears extremely bullish, with all short-term EMA lines positioned well above the long-term ones and large distances between these moving averages. This alignment signals strong upward momentum and hype around artificial intelligence coins.
EMA lines, or Exponential Moving Averages, are tools used by traders to smooth price data. They give more weight to recent movements to highlight current trends more effectively. With the short-term EMAs comfortably above the long-term ones, buying pressure is dominating, keeping WLD in a solid uptrend.
Read more: Worldcoin (WLD) Price Prediction 2024/2025/2030
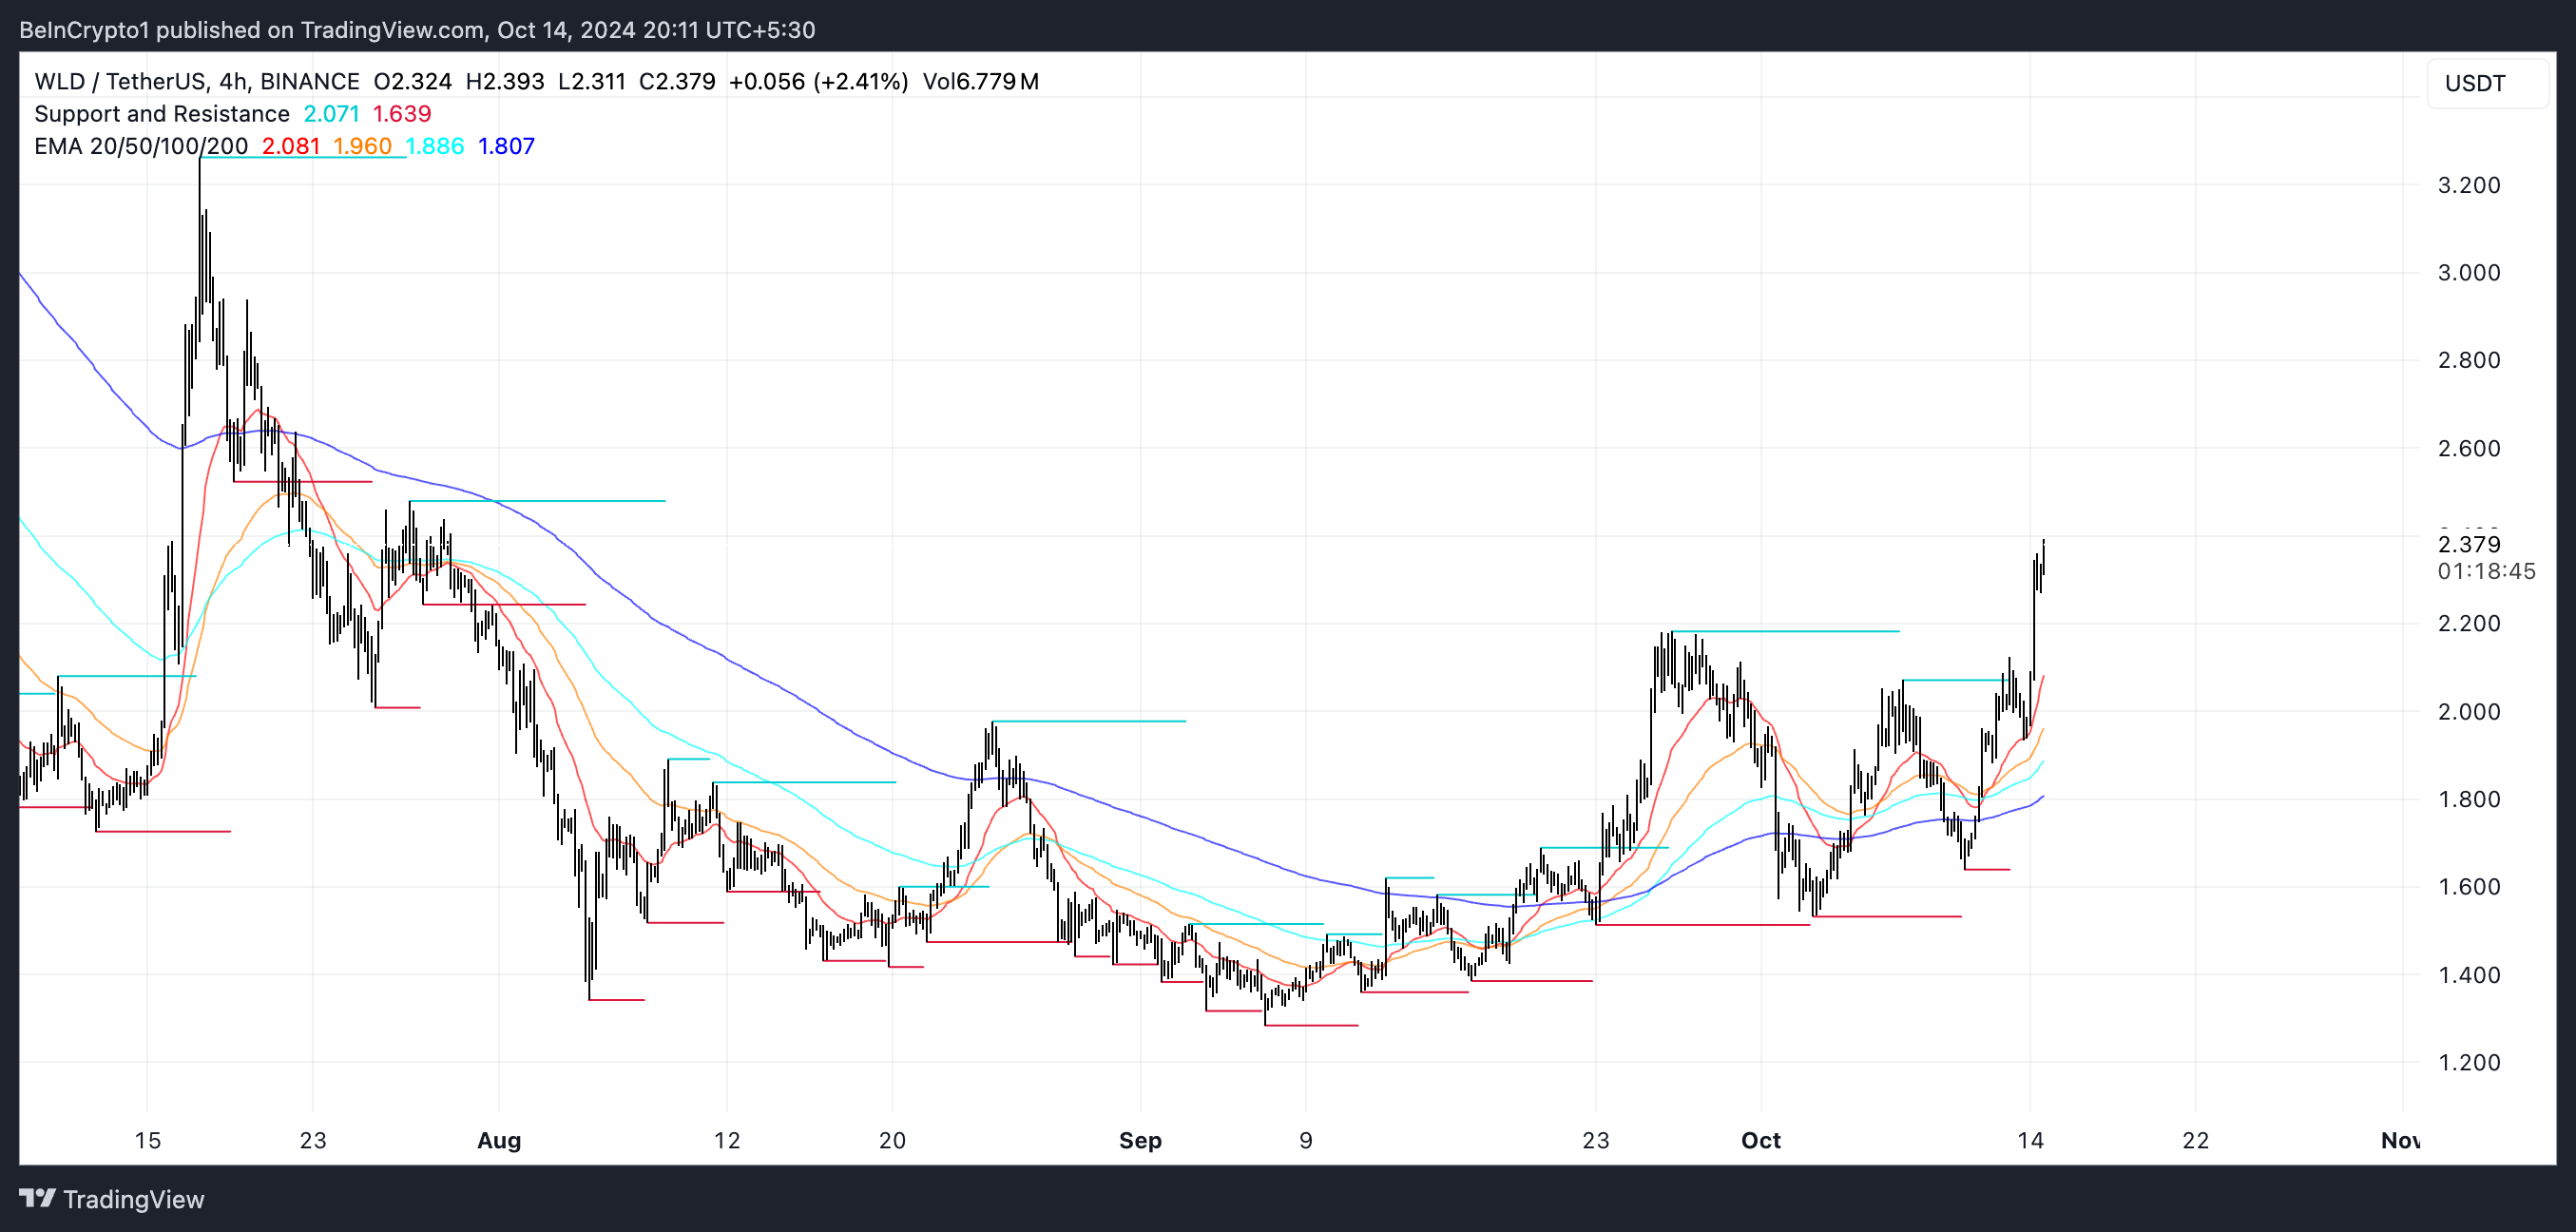 WLD EMA Lines and Support and Resistance. Source: TradingView
If WLD continues its upward trajectory, it could soon test the resistance level at $2.47. Should it successfully break through this resistance, WLD has the potential to reach $3.2, which would be its highest price since July — an impressive 37% gain from current levels.
However, caution is needed, as the BBTrend indicator shows that the trend could reverse at any point. If a reversal occurs, WLD price might drop to test support at $2.24. If that level fails to hold, it could fall further, possibly reaching $1.72 or even $1.51, indicating a significant downside risk if the bullish momentum fades.
Recommended Articles


