

NFP steamrolls US Dollar bears, now the rally has to stick
- May Nonfarm Payrolls came in at more than double consensus, driving a sharp, broad Dollar rally.
- Hawkish Fed commentary and rate futures tilting toward hikes reinforced the bid.
- Cooling annual wage growth and a level that has rejected the Dollar repeatedly this year leave the breakout's durability in doubt.
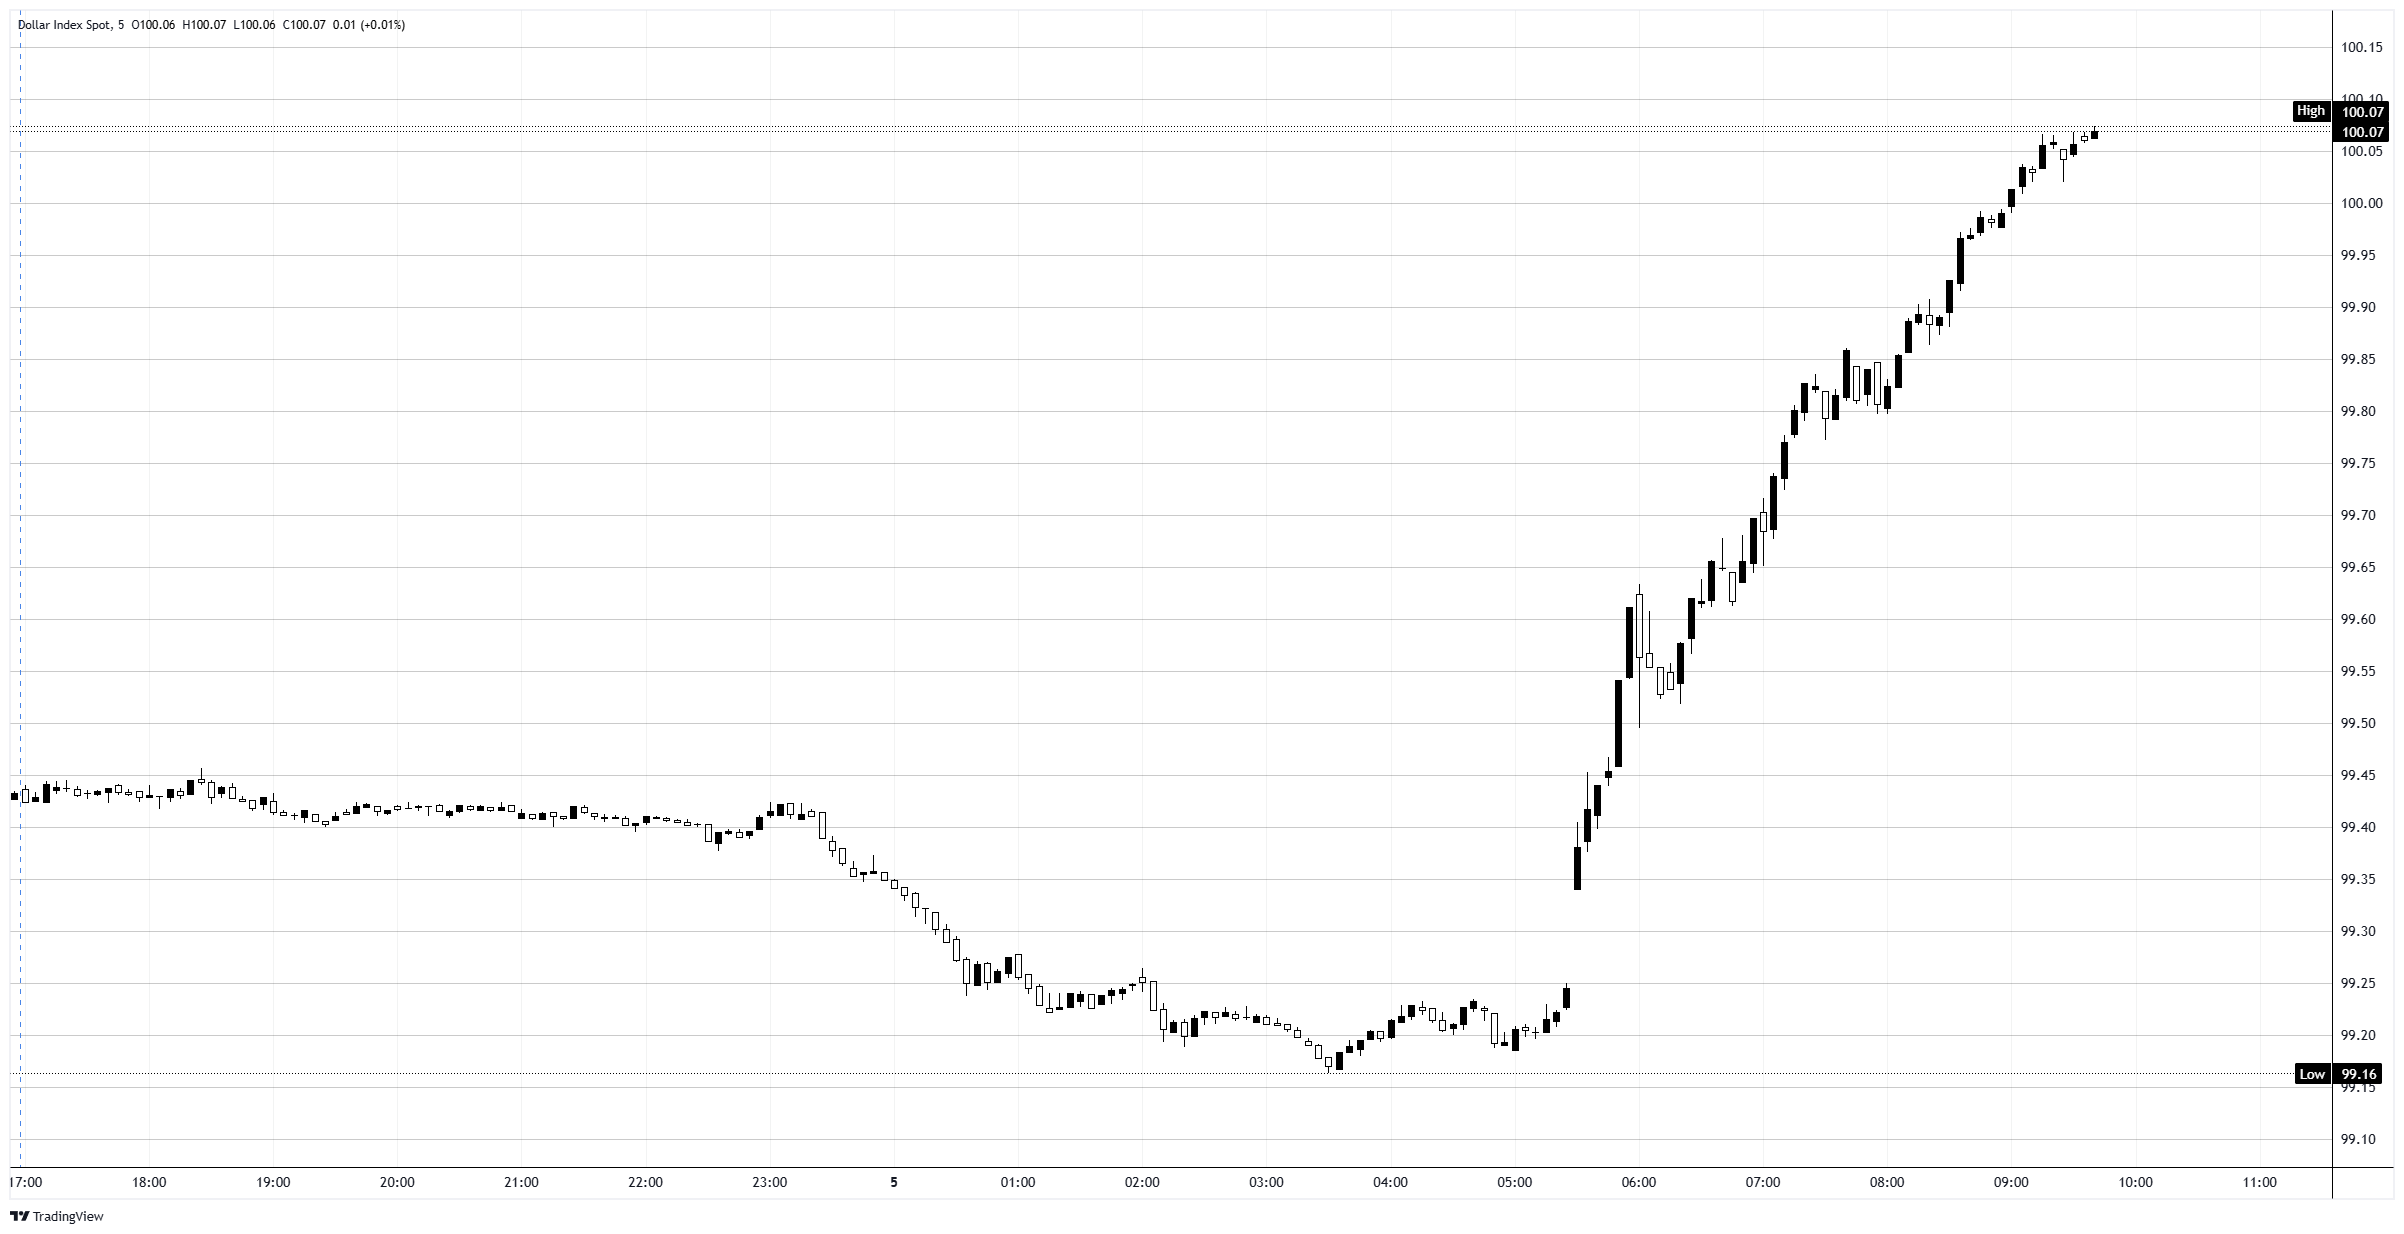
The market walked into Friday's payrolls report braced for weakness, and the US Dollar Index (DXY) made it pay. Consensus looked for a soft 85K of new jobs in May, the kind of number that fits a cooling labor market and a Federal Reserve (Fed) edging toward cuts. Instead, the print landed at 172K, more than double the estimate, and the Dollar tore higher across the board, ripping from near 99.20 up through the 100.00 handle for the first time in eight weeks. One number flipped two months of bearish positioning.
The number that ran the bears over
The May Nonfarm Payrolls (NFP) figure did not just beat; it embarrassed the low bar set for it. At 172K against an 85K consensus, with the prior month revised up to 179K, the report read as a labor market that refuses to roll over. The Unemployment Rate held at 4.3% and the broader U6 underemployment gauge ticked down to 8.1%, while annual average hourly earnings eased to 3.4% YoY from 3.6%. The composition was less heroic than the headline: gains clustered in leisure and hospitality, local government, and health care, while finance shed jobs. Against positioning set up for a miss, though, the size of the beat was all that mattered.
A Fed already leaning the Dollar's way
The payrolls shock landed on top of a Fed that has been talking tougher. Cleveland Fed President Hammack warned earlier in the week that rates may need to rise rather than fall if inflation refuses to cool, and her follow-up remarks at 14:20 GMT carried the same hawkish edge. That lines up with what rate markets are pricing. The Chicago Mercantile Exchange (CME) FedWatch tool shows the June 16-17 Federal Open Market Committee (FOMC) meeting as a near-certain hold, but further out the distribution drifts higher, with rising odds of hikes through late 2026 and into 2027 rather than the cuts traders spent much of the spring chasing. A jobs beat that keeps the labor side of the mandate firm only reinforces that lean, and the Dollar took the hint.
Why the 100 reclaim still deserves side-eye
Here is the catch. The 100.00 area has been a graveyard for Dollar rallies all year. The daily chart shows the index running to fresh highs above 100.50 in early April before getting sold hard, sliding back toward 96.00 by the middle of the month, then grinding sideways for weeks. Friday's surge reclaims the handle, but reclaiming it and holding it are different things. The wage data quietly cuts against the hawkish story too: annual earnings cooled, so the inflation worry behind the hike chatter leans more on energy prices and the Iran-driven Crude Oil rally than on an overheating labor market. A single hot payrolls print, off a low consensus, is a reason to respect the move, not to assume it sticks.
Levels and the tests ahead
For now the Dollar has momentum and a backdrop that favors it, but the breakout has to earn the benefit of the doubt.
Upside: a daily close that holds above 100.00 keeps the door open toward the early-April highs near 100.50. A failure to hold the handle would mark another false break.
Downside: the intraday breakout pivot near 99.50 is first support, then the pre-payrolls base around 99.20 and the session low close to 99.15. A slide back under 99.50 would put the rally's credibility back in question.
Bias: constructive while 100.00 holds as support, skeptical the moment it does not. The real verdict comes from the June Consumer Price Index (CPI) report and the FOMC on June 16-17, which decide whether this hawkish repricing has legs or fades like the last few runs at this zone.
US Dollar Index 5-minute chart
US Dollar FAQs
The US Dollar (USD) is the official currency of the United States of America, and the ‘de facto’ currency of a significant number of other countries where it is found in circulation alongside local notes. It is the most heavily traded currency in the world, accounting for over 88% of all global foreign exchange turnover, or an average of $6.6 trillion in transactions per day, according to data from 2022. Following the second world war, the USD took over from the British Pound as the world’s reserve currency. For most of its history, the US Dollar was backed by Gold, until the Bretton Woods Agreement in 1971 when the Gold Standard went away.
The most important single factor impacting on the value of the US Dollar is monetary policy, which is shaped by the Federal Reserve (Fed). The Fed has two mandates: to achieve price stability (control inflation) and foster full employment. Its primary tool to achieve these two goals is by adjusting interest rates. When prices are rising too quickly and inflation is above the Fed’s 2% target, the Fed will raise rates, which helps the USD value. When inflation falls below 2% or the Unemployment Rate is too high, the Fed may lower interest rates, which weighs on the Greenback.
In extreme situations, the Federal Reserve can also print more Dollars and enact quantitative easing (QE). QE is the process by which the Fed substantially increases the flow of credit in a stuck financial system. It is a non-standard policy measure used when credit has dried up because banks will not lend to each other (out of the fear of counterparty default). It is a last resort when simply lowering interest rates is unlikely to achieve the necessary result. It was the Fed’s weapon of choice to combat the credit crunch that occurred during the Great Financial Crisis in 2008. It involves the Fed printing more Dollars and using them to buy US government bonds predominantly from financial institutions. QE usually leads to a weaker US Dollar.
Quantitative tightening (QT) is the reverse process whereby the Federal Reserve stops buying bonds from financial institutions and does not reinvest the principal from the bonds it holds maturing in new purchases. It is usually positive for the US Dollar.
Recommended Articles


