

Quant Price Forecast: QNT rally capped at key resistance poses bearish reversal risk

Source Fxstreet
  • Quant is down over 4% on Wednesday, hovering around $250 after two consecutive days of recovery.
  • Derivatives data shows mixed retail sentiment, with Open Interest declining by roughly 7% over 24 hours despite funding rates recovering to zero.
  • The technical outlook for QNT indicates a bearish bias, as price remains capped and risks a breakout of the support trendline.

Quant (QNT) price is down over 4% on Wednesday, risking a drop below $250 as buying pressure eases after a more than 350% rally last month. Retail strength in the DeFi token remains mixed, with Open Interest down over 6% in the last 24 hours, while negative funding rates ease toward neutral levels. The technical outlook for Quant suggests a downside bias as the price tests the bearish breakout of a support trendline near $252.

Retail speculation takes a hit

Quant gained over 350% last month, driven by its partnership with The Clearing House to become a settlement layer for tokenized deposits across 25 major US banks. This led to a sharp increase in retail buildup but also flipped the funding rates negative as traders anticipated a corrective move in the overstretched rally.

Quant derivatives data now shows that the retail speculation is easing. CoinGlass data shows that QNT futures Open Interest (OI) is down nearly 7% over the last 24 hours, to $180.66 million, indicating either a positional wipeout or a reduction in notional value as the spot price declines. At the same time, the funding rate has increased to -0.0018%, from -0.0544% the previous day, suggesting a reduced bearish bias as traders are less willing to buy short positions at a premium.

Given the OI drop and easing funding rates, QNT derivatives suggest a mixed bias among traders.
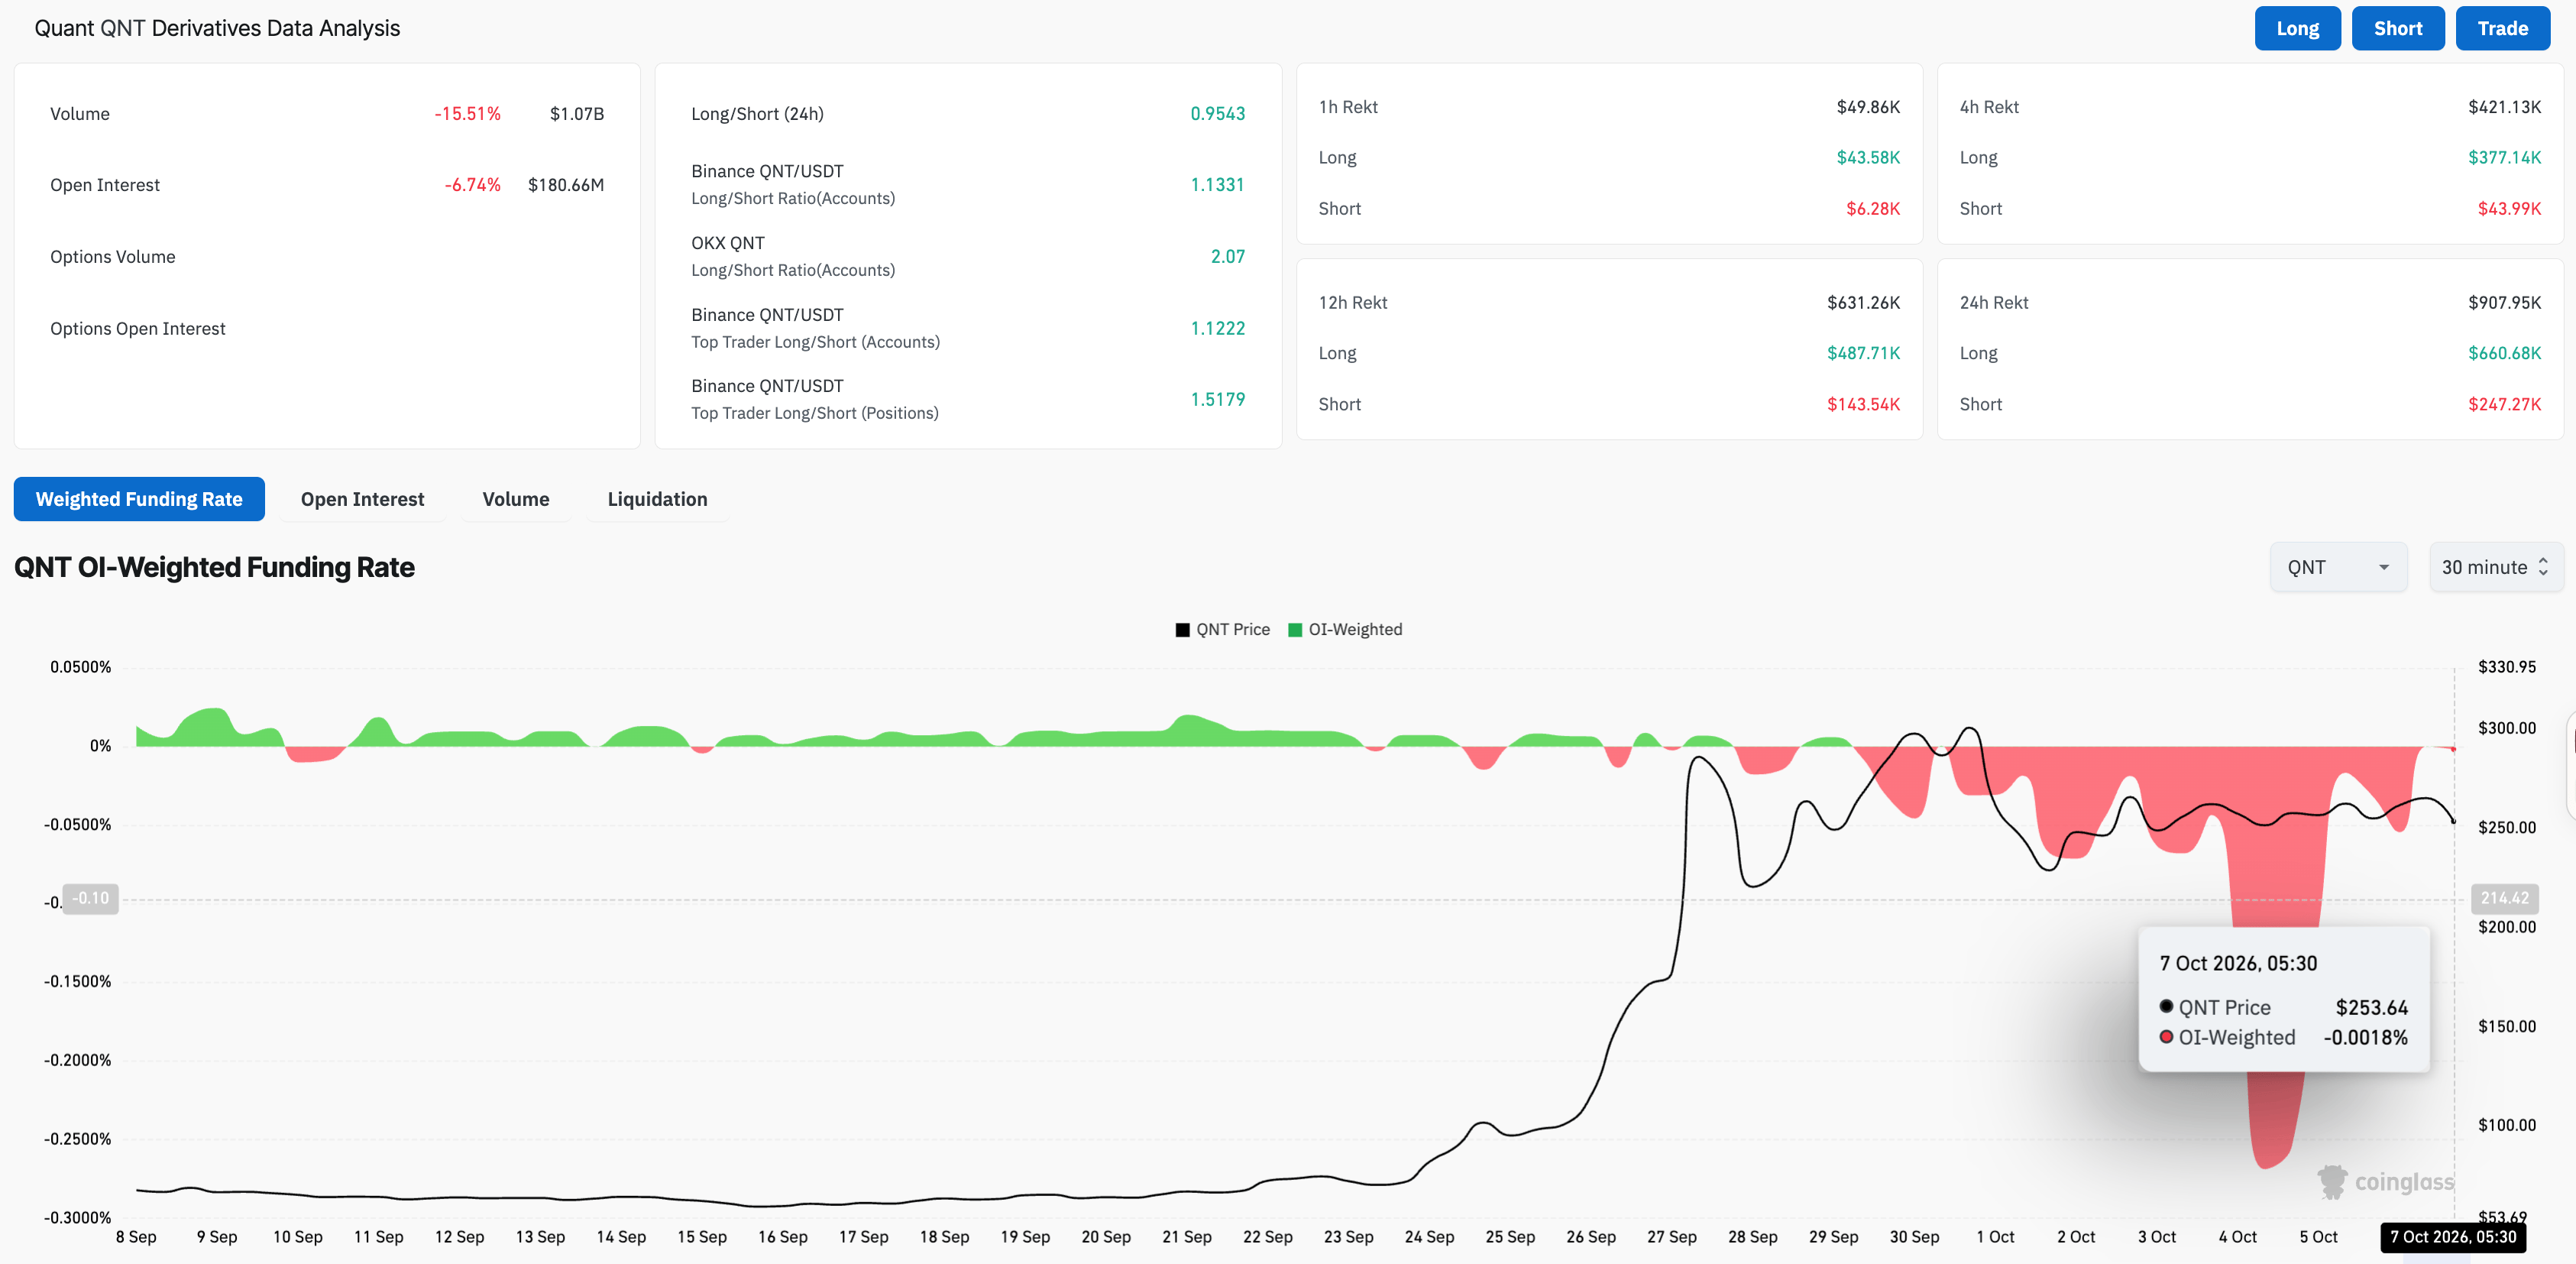
QNT derivatives data. Source: CoinGlass

Technical outlook: Will Quant price drop below $250?

Quant price hovers around $250 at press time on Wednesday, projecting a mild corrective shift in near-term bias. The QNT price holds above a dense support layer formed by the 50-, 100-, and 200-period Exponential Moving Averages (EMAs) on the four-hour chart at $242, $202, and $154, respectively, underpinning the uptrend structure.

Momentum remains neutral on the four-hour chart, with the Relative Strength Index (RSI) near 48, hovering around the midline, and the Moving Average Convergence Divergence (MACD) marginally below its signal line, hinting at steady rather than decisive pressure.

From a technical perspective, the 50% retracement measured from $373 to $195, at $269, serves as the immediate resistance level, which continues to cap gains from last week. The intraday pullback from this resistance zone risks breaking below a rising trendline connecting the Saturday and Monday lows near $252.

A confirmed breakout below the $250 round figure could target the 50-period EMA at $238, then the October 2 low at $223, and the 100-period EMA at $202.
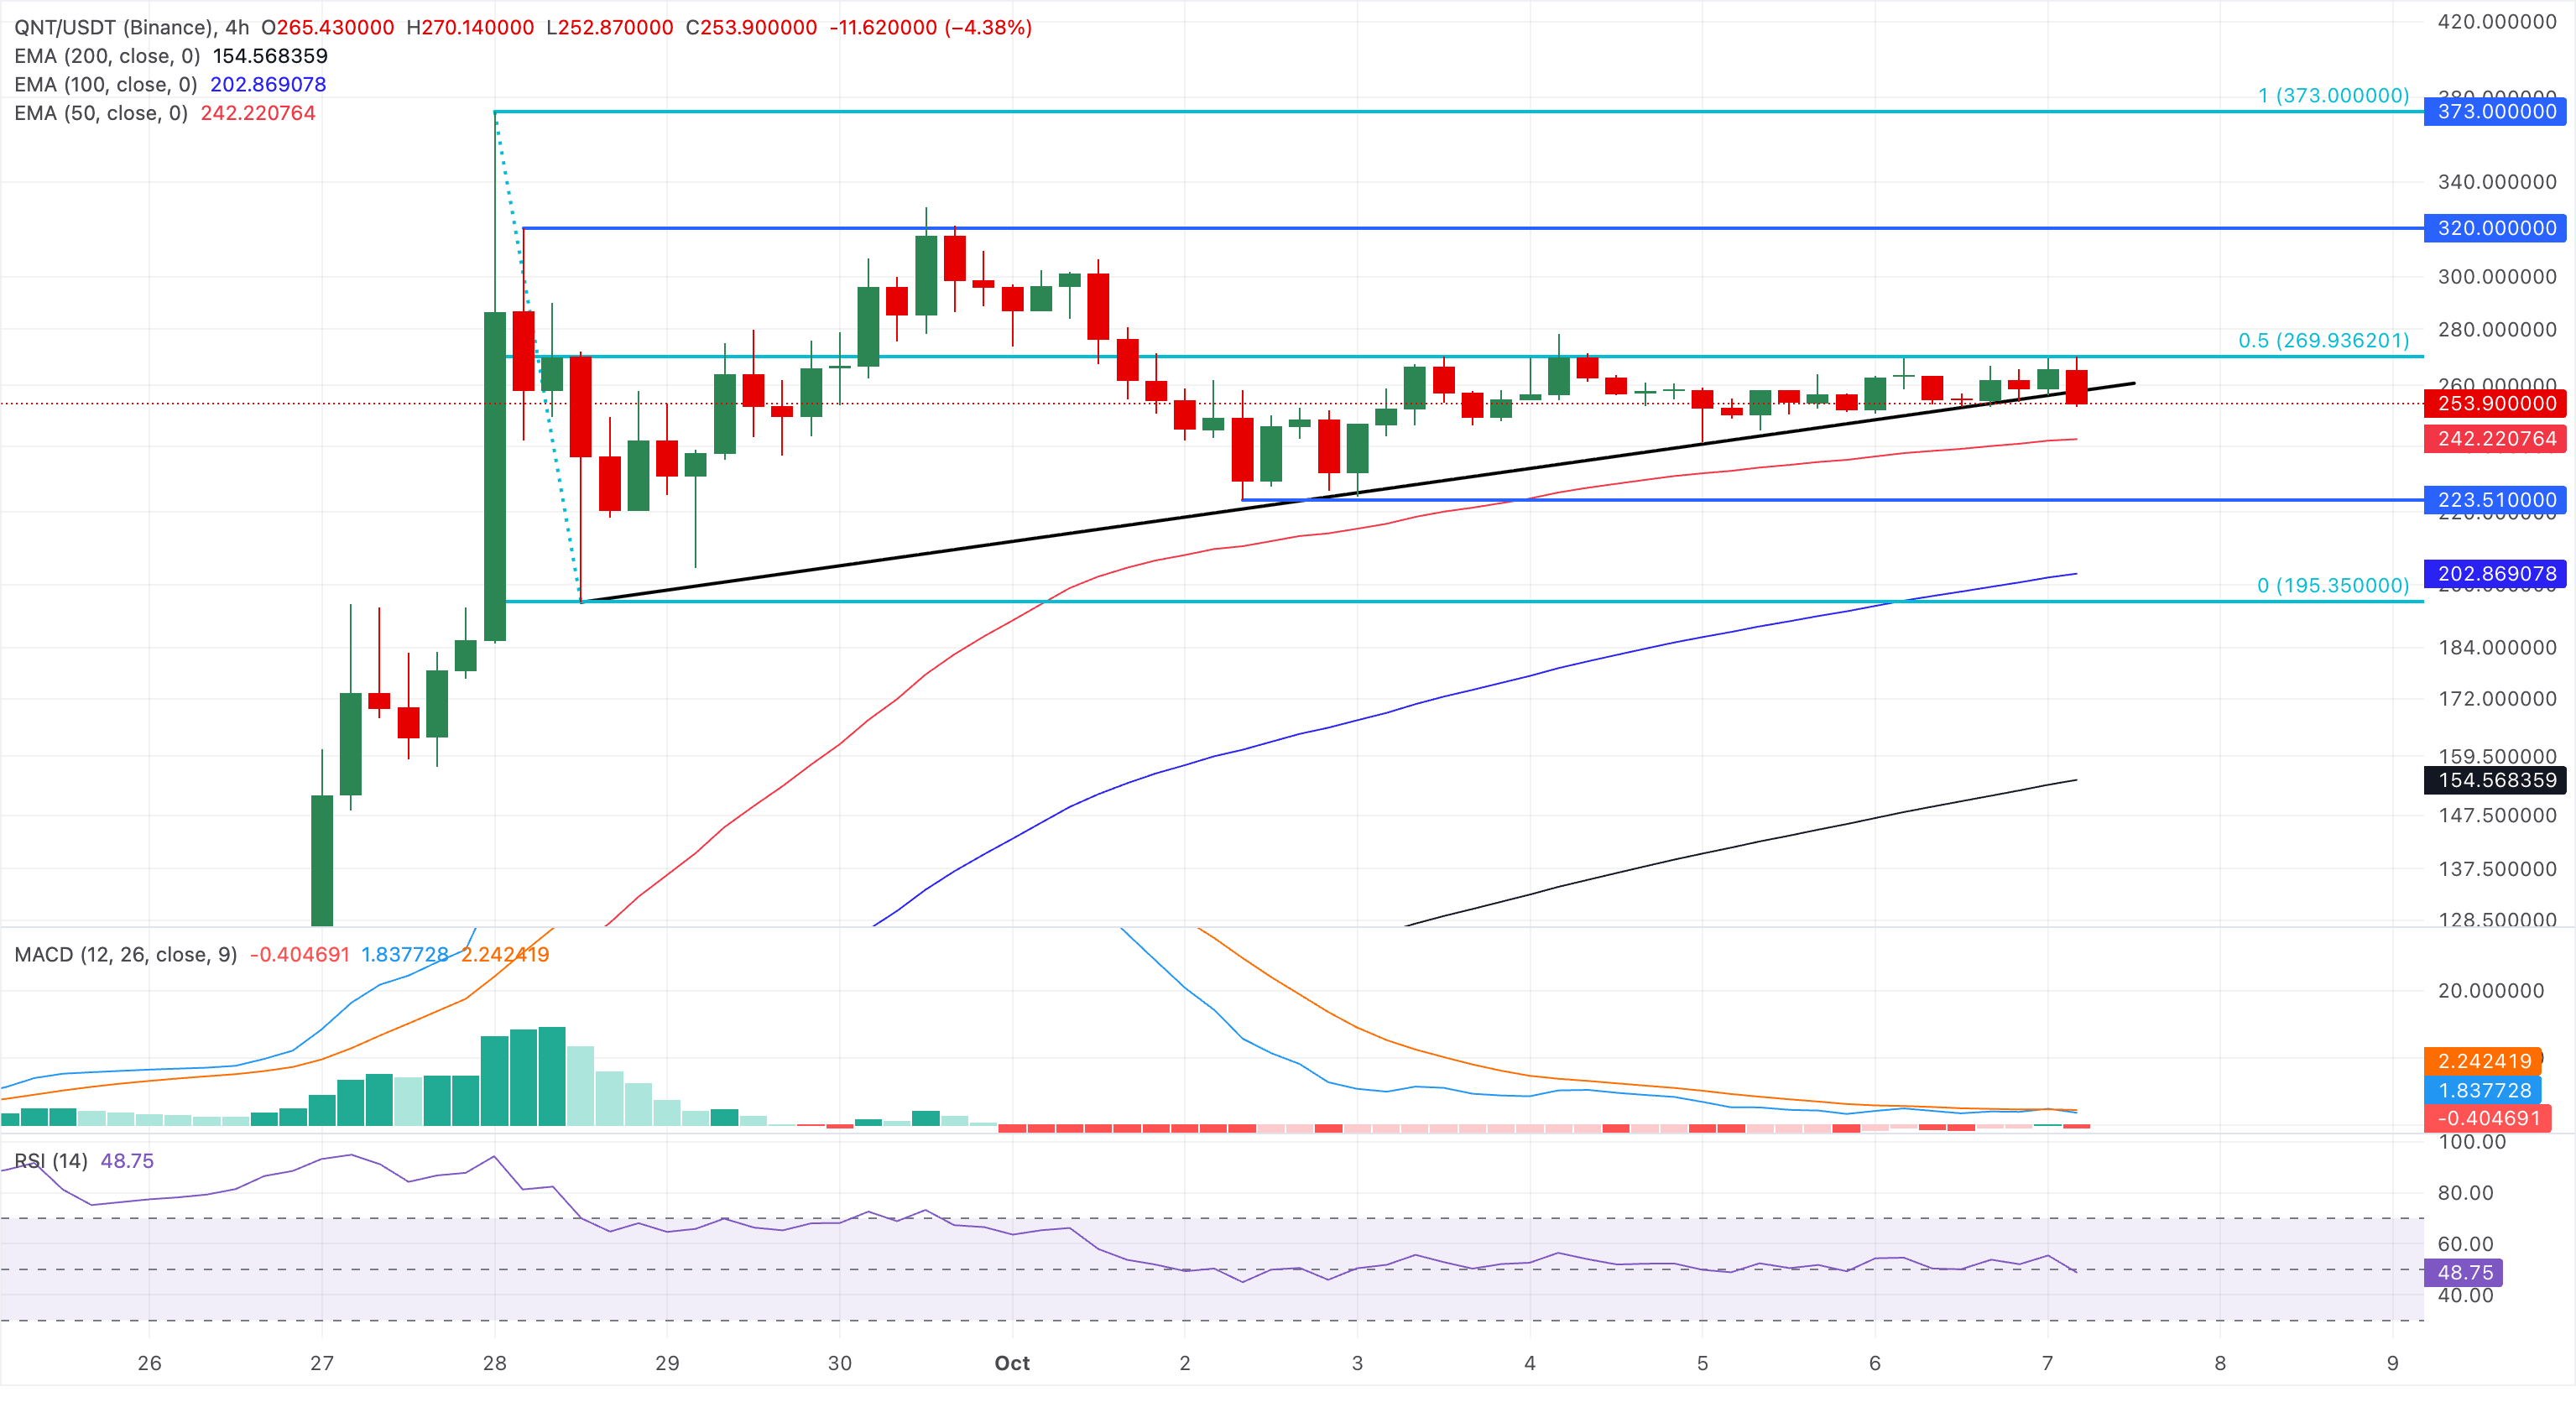
QNT/USDT four-hour price chart.

Looking up, Quant must reclaim the 50% retracement at $269, which could extend the rally beyond $300, targeting the $320 level, which capped gains last week. Beyond which, the $373 swing high and the 127.2% Fibonacci extension level at $444 could serve as the next bullish targets.

(The technical analysis of this story was written with the help of an AI tool. Know more.)

Disclaimer: For information purposes only. Past performance is not indicative of future results.
placeholder
Bitcoin Drops Below $83,000 as US Government Transfers Over 10,000 BTC, Sparking Panic Over Potential Selling PressureUS government transfers over 10,000 BTC as Bitcoin extends losses to breach $83,000, but a further sharp decline remains unlikely.On October 8, Bitcoin (BTC) extended its recent losses, f
Author  TradingKey
8 hours ago
US government transfers over 10,000 BTC as Bitcoin extends losses to breach $83,000, but a further sharp decline remains unlikely.On October 8, Bitcoin (BTC) extended its recent losses, f
placeholder
Gold falls to a two-month low as real yields bite — can $4,000 hold?Gold hit a two-month low on 7 October, with spot touching roughly $4,090 and COMEX December futures closing at $4,140.70, even as the New York Fed's one-year inflation expectation rose to 3.9% — its highest since May 2023. The paradox resolves through real yields: the 30-year Treasury yield reached 5.732% intraday, its highest since 2002. Here are the levels, the institutional split, and the scenarios into tonight's jobless claims and 30-year auction.
Author  Irene Q.
8 hours ago
Gold hit a two-month low on 7 October, with spot touching roughly $4,090 and COMEX December futures closing at $4,140.70, even as the New York Fed's one-year inflation expectation rose to 3.9% — its highest since May 2023. The paradox resolves through real yields: the 30-year Treasury yield reached 5.732% intraday, its highest since 2002. Here are the levels, the institutional split, and the scenarios into tonight's jobless claims and 30-year auction.
placeholder
Gold Price Forecast: Gold Drops Below $4,100, Could Test $4,000 in Short TermAs of the Asian session on October 8, gold prices (XAUUSD) maintained a weak rebound trend today, with the latest price trading around $4,120; yesterday, gold prices briefly fell below $4
Author  TradingKey
9 hours ago
As of the Asian session on October 8, gold prices (XAUUSD) maintained a weak rebound trend today, with the latest price trading around $4,120; yesterday, gold prices briefly fell below $4
placeholder
Euro slides to a 17-month low as France's budget crisis spreads — can 1.12 hold?EUR/USD touched 1.1162 on 5 October, its weakest level in 17 months, as France's budget standoff pushed the 10-year OAT above 5% and the OAT-Bund spread to roughly 160bp — the widest since the 2011-12 eurozone debt crisis. The euro now trades near 1.1215 ahead of US jobless claims and a $22 billion 30-year Treasury auction. Here are the levels and the two scenarios to watch.
Author  Irene Q.
9 hours ago
EUR/USD touched 1.1162 on 5 October, its weakest level in 17 months, as France's budget standoff pushed the 10-year OAT above 5% and the OAT-Bund spread to roughly 160bp — the widest since the 2011-12 eurozone debt crisis. The euro now trades near 1.1215 ahead of US jobless claims and a $22 billion 30-year Treasury auction. Here are the levels and the two scenarios to watch.
placeholder
Today’s Market Recap: 10-Year Treasury Yield Hits Highest Since 2002,U.S. Stocks Fall as Brent Barely Holds $100Tracking the Market TrendTradingKey - On October 7, U.S. Eastern Time, the 10-year Treasury yield climbed to an intraday high of 5.36%, its highest level since 2002, while all three major U.S. stock i
Author  TradingKey
15 hours ago
Tracking the Market TrendTradingKey - On October 7, U.S. Eastern Time, the 10-year Treasury yield climbed to an intraday high of 5.36%, its highest level since 2002, while all three major U.S. stock i
goTop
quote