


Crypto Today: Bitcoin holds $83K as Ethereum remains below $2,700 and XRP consolidates
- Bitcoin slides and trades near $83,000 on Wednesday as momentum indicators sustain weakness.
- Ethereum faces buyer exhaustion with the price still below $2,700, falling for two consecutive days.
- XRP trades near the $1.50 pivotal level as bulls push to regain trend control.
Bitcoin (BTC) trades lethargically on Wednesday, with bulls battling to defend the immediate $83,000 level as immediate support. Demand extends toward $80,000, which bulls must defend to restore the uptrend toward the September peak above $87,000.
Ethereum (ETH) trades in tandem with Bitcoin, holding below key levels of $2,700 on the upside and $2,600 on the downside. Ripple (XRP), meanwhile, hovers near $1.50, a level that, if defended, could let bulls build momentum ahead of the next breakout attempt, targeting September highs at $1.66 and the August peak of $1.70.
Despite the visible prevailing struggles following last week’s rally, the broader market structure remains positive. According to K33 Research analysts, the drop in Open Interest (OI) to 49,000 BTC implies reduced sell-side pressure amid a low probability of liquidations.
“Open interest has fallen by 49k BTC in an unusually orderly reset driven by profit realization, while spot volumes stayed below yearly averages despite higher prices, a sign of sustained sell-side exhaustion,” K33 Research analysis stated in the weekly report, adding, “with little leverage left to trigger forced liquidations and holders reluctant to sell 33% below ATH, we see considerable upside asymmetry."
Technical analysis: Bitcoin struggles to regain momentum
Bitcoin trades above $83,000, extending a constructive bullish bias as price holds well above the 50-day, 100-day and 200-day Moving Average Exponentials (EMAs). The SuperTrend line also trails notably below spot, reinforcing a supportive backdrop, while the Relative Strength Index (RSI) near 58 suggests positive but not overstretched momentum.
By contrast, the Moving Average Convergence Divergence (MACD) indicator has slipped into negative territory with a softening histogram, hinting that upside momentum is losing some steam even as the broader trend remains pointed higher.
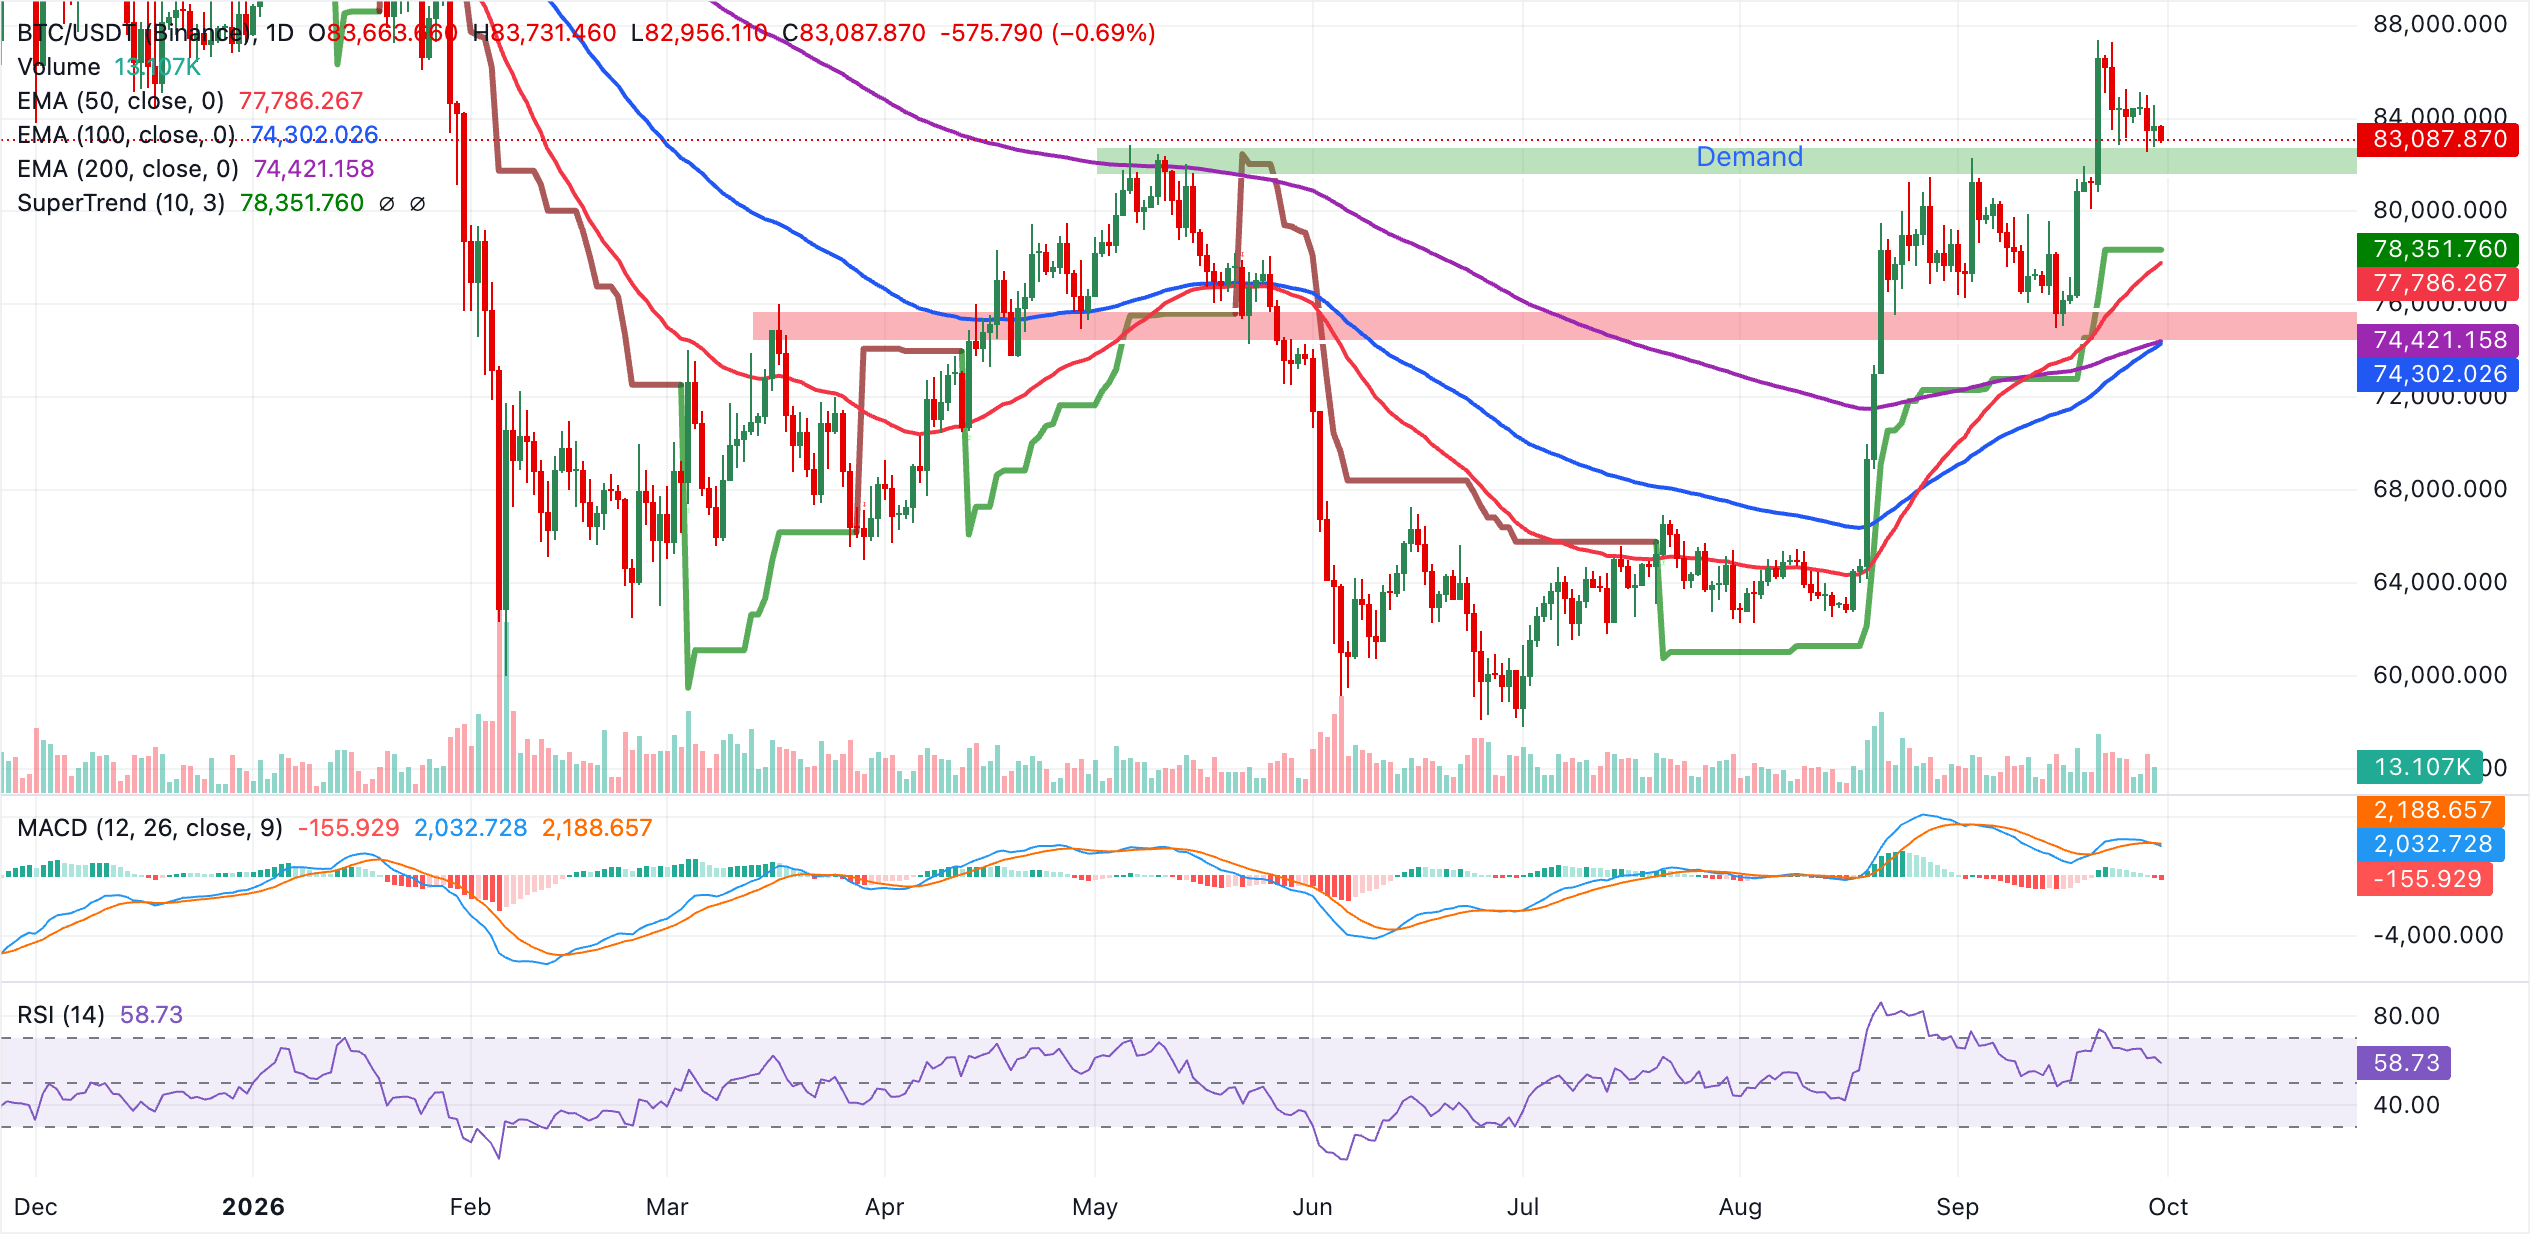
On the downside, initial support aligns with the SuperTrend level around 7$8,352, closely backed by the 50-day EMA near $77,786, forming a nearby demand zone for any pullback. Deeper declines would expose a stronger support cluster where the 100-day EMA at $74,302 and the 200-day EMA at $74,421 converge, a zone expected to attract dip-buying interest while price continues to trade comfortably above these longer-term averages.
Altcoins technical analysis: Ethereum trades under pressure as XRP eyes recovery
Ethereum extends its downward move to $2,669 at the time of writing. Despite the two-day correction, the smart contract token maintains a bullish near-term bias as price holds well above the key EMAs. The 50-day EMA at $2,446, the 100-day EMA at $2,282 and the 200-day EMA at $2,256 all sit comfortably below spot, reinforcing an underlying uptrend, while the SuperTrend line at $2,434 provides additional structural support.
Momentum is moderately constructive, with the RSI hovering around 60, although the negative MACD reading hints at some waning bullish pressure after the recent advance.
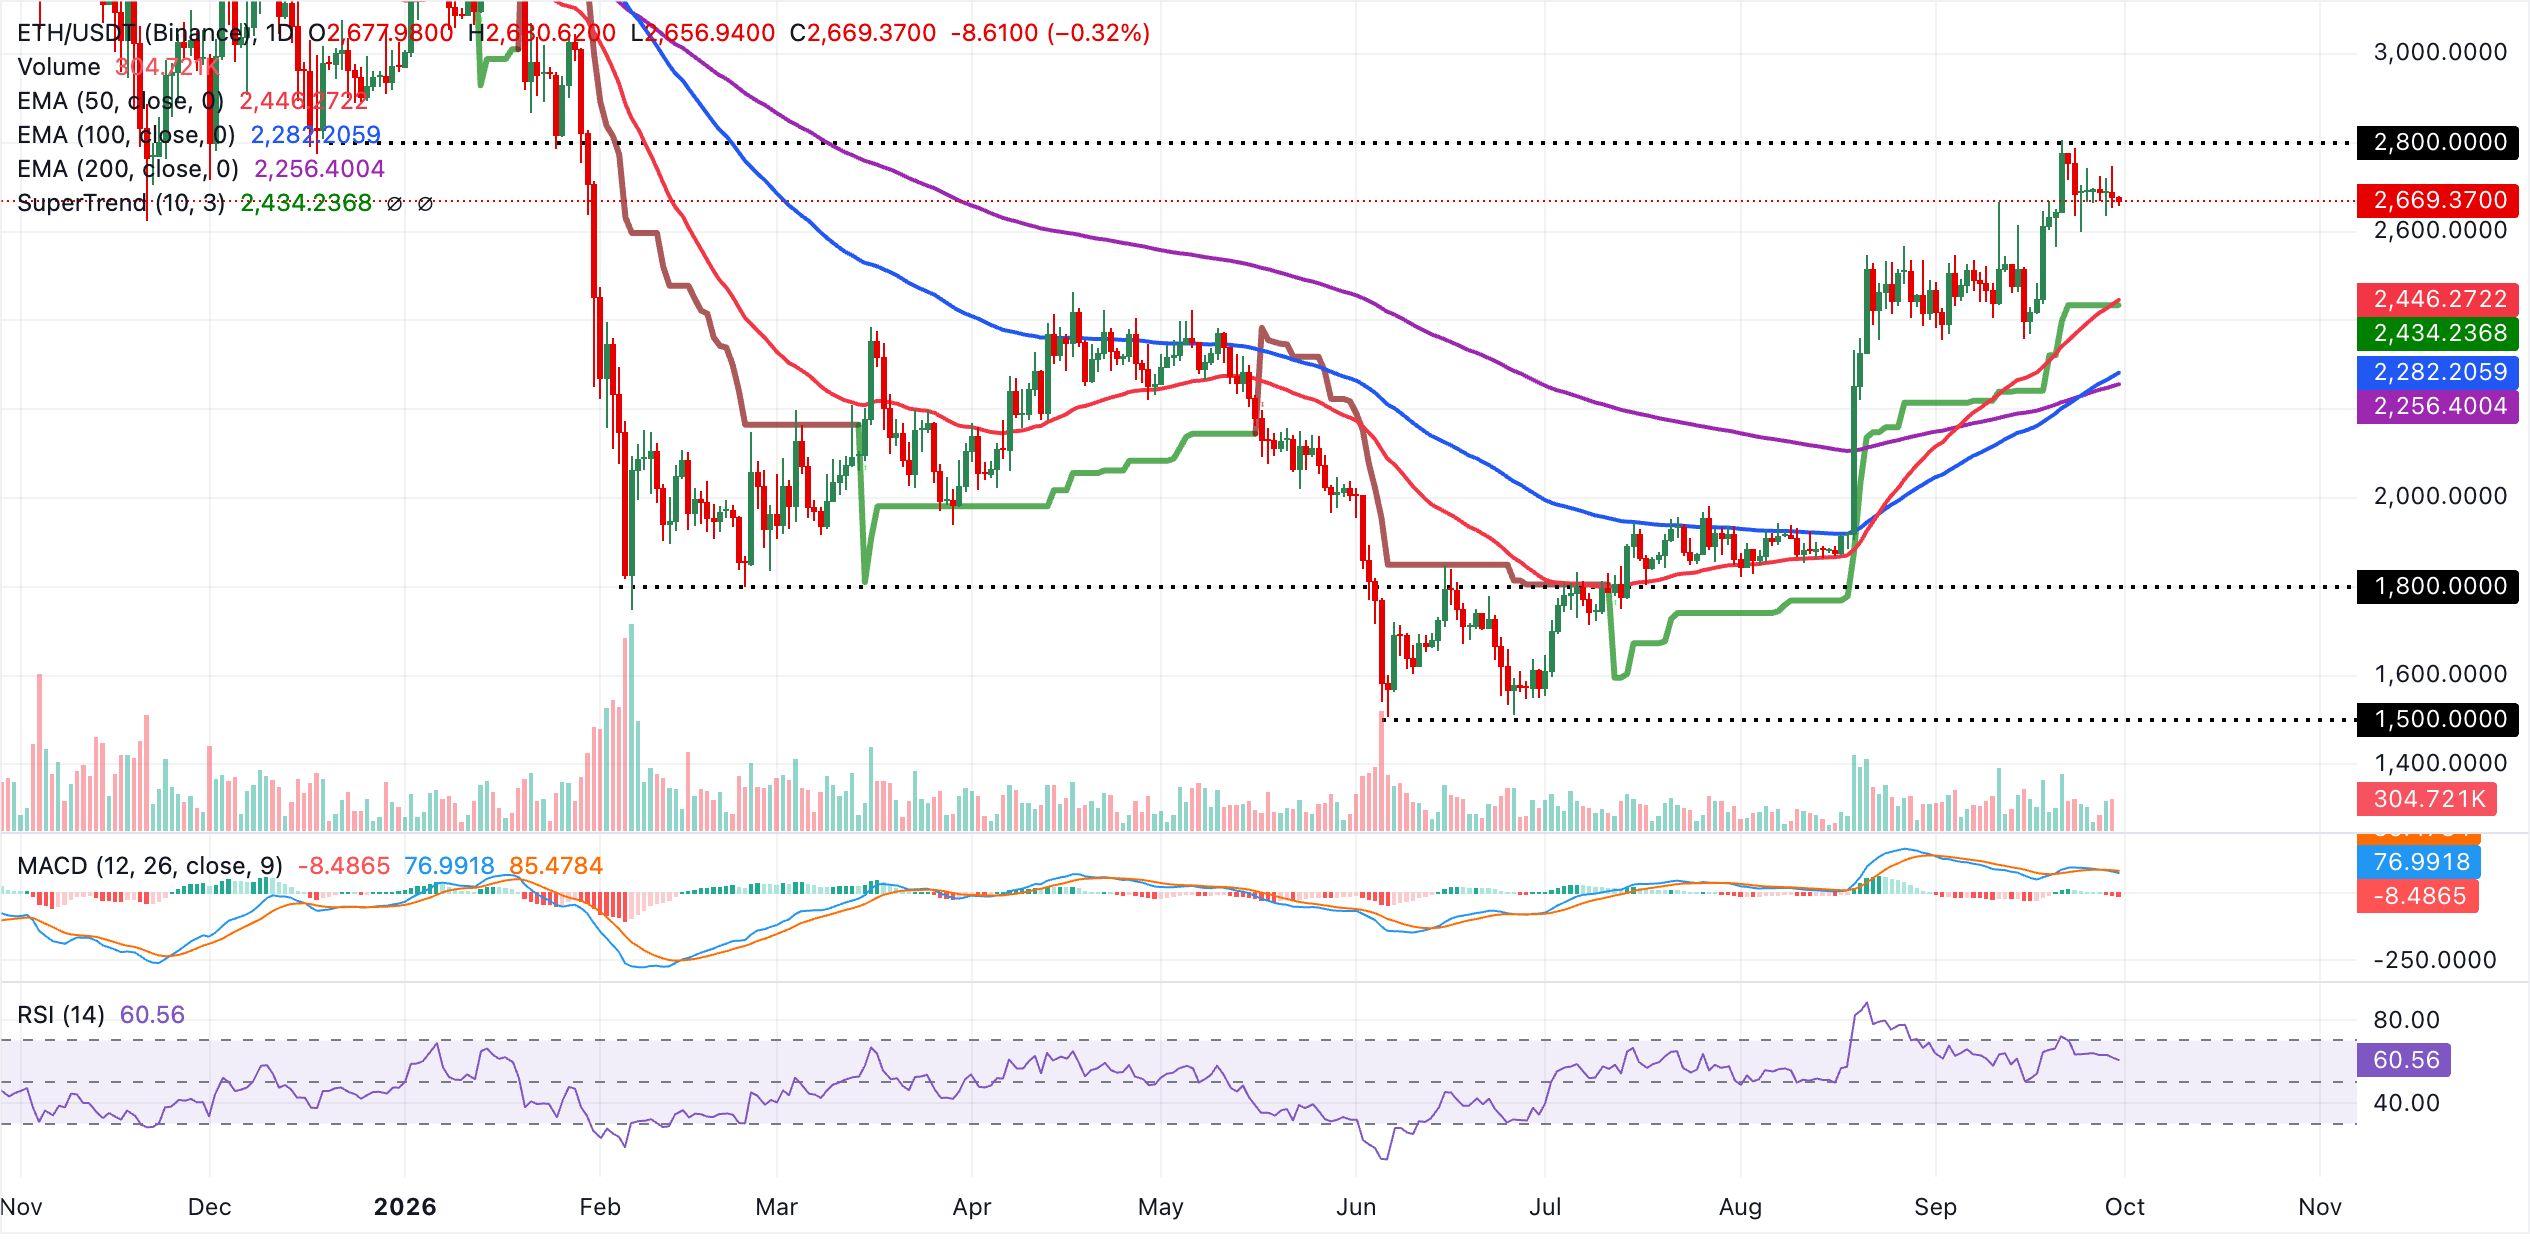
On the downside, initial support lies at the 50-day EMA at $2,446, closely followed by the SuperTrend level at $2,434, which together form a nearby demand zone that bulls would aim to defend on pullbacks. A deeper correction would expose the 100-day EMA at $2,282 before the more strategic 200-day EMA at $2,256, where the broader bullish structure would be tested. With no immediate overhead indicators on the daily chart, the pair remains technically supported as long as it trades above these clustered moving average supports.
XRP, meanwhile, trades near $1.50, extending its advance above the key EMAs. The 50-day EMA at $1.37 and the 200-day EMA at $1.37 sit well below spot and together suggest a constructive medium-term trend, while the 100-day EMA at $1.31 reinforces a solid demand layer beneath the market.
Momentum remains supportive, with the RSI holding near 56, although the MACD has slipped marginally below the zero line, suggesting the latest push higher may be losing some immediate traction.
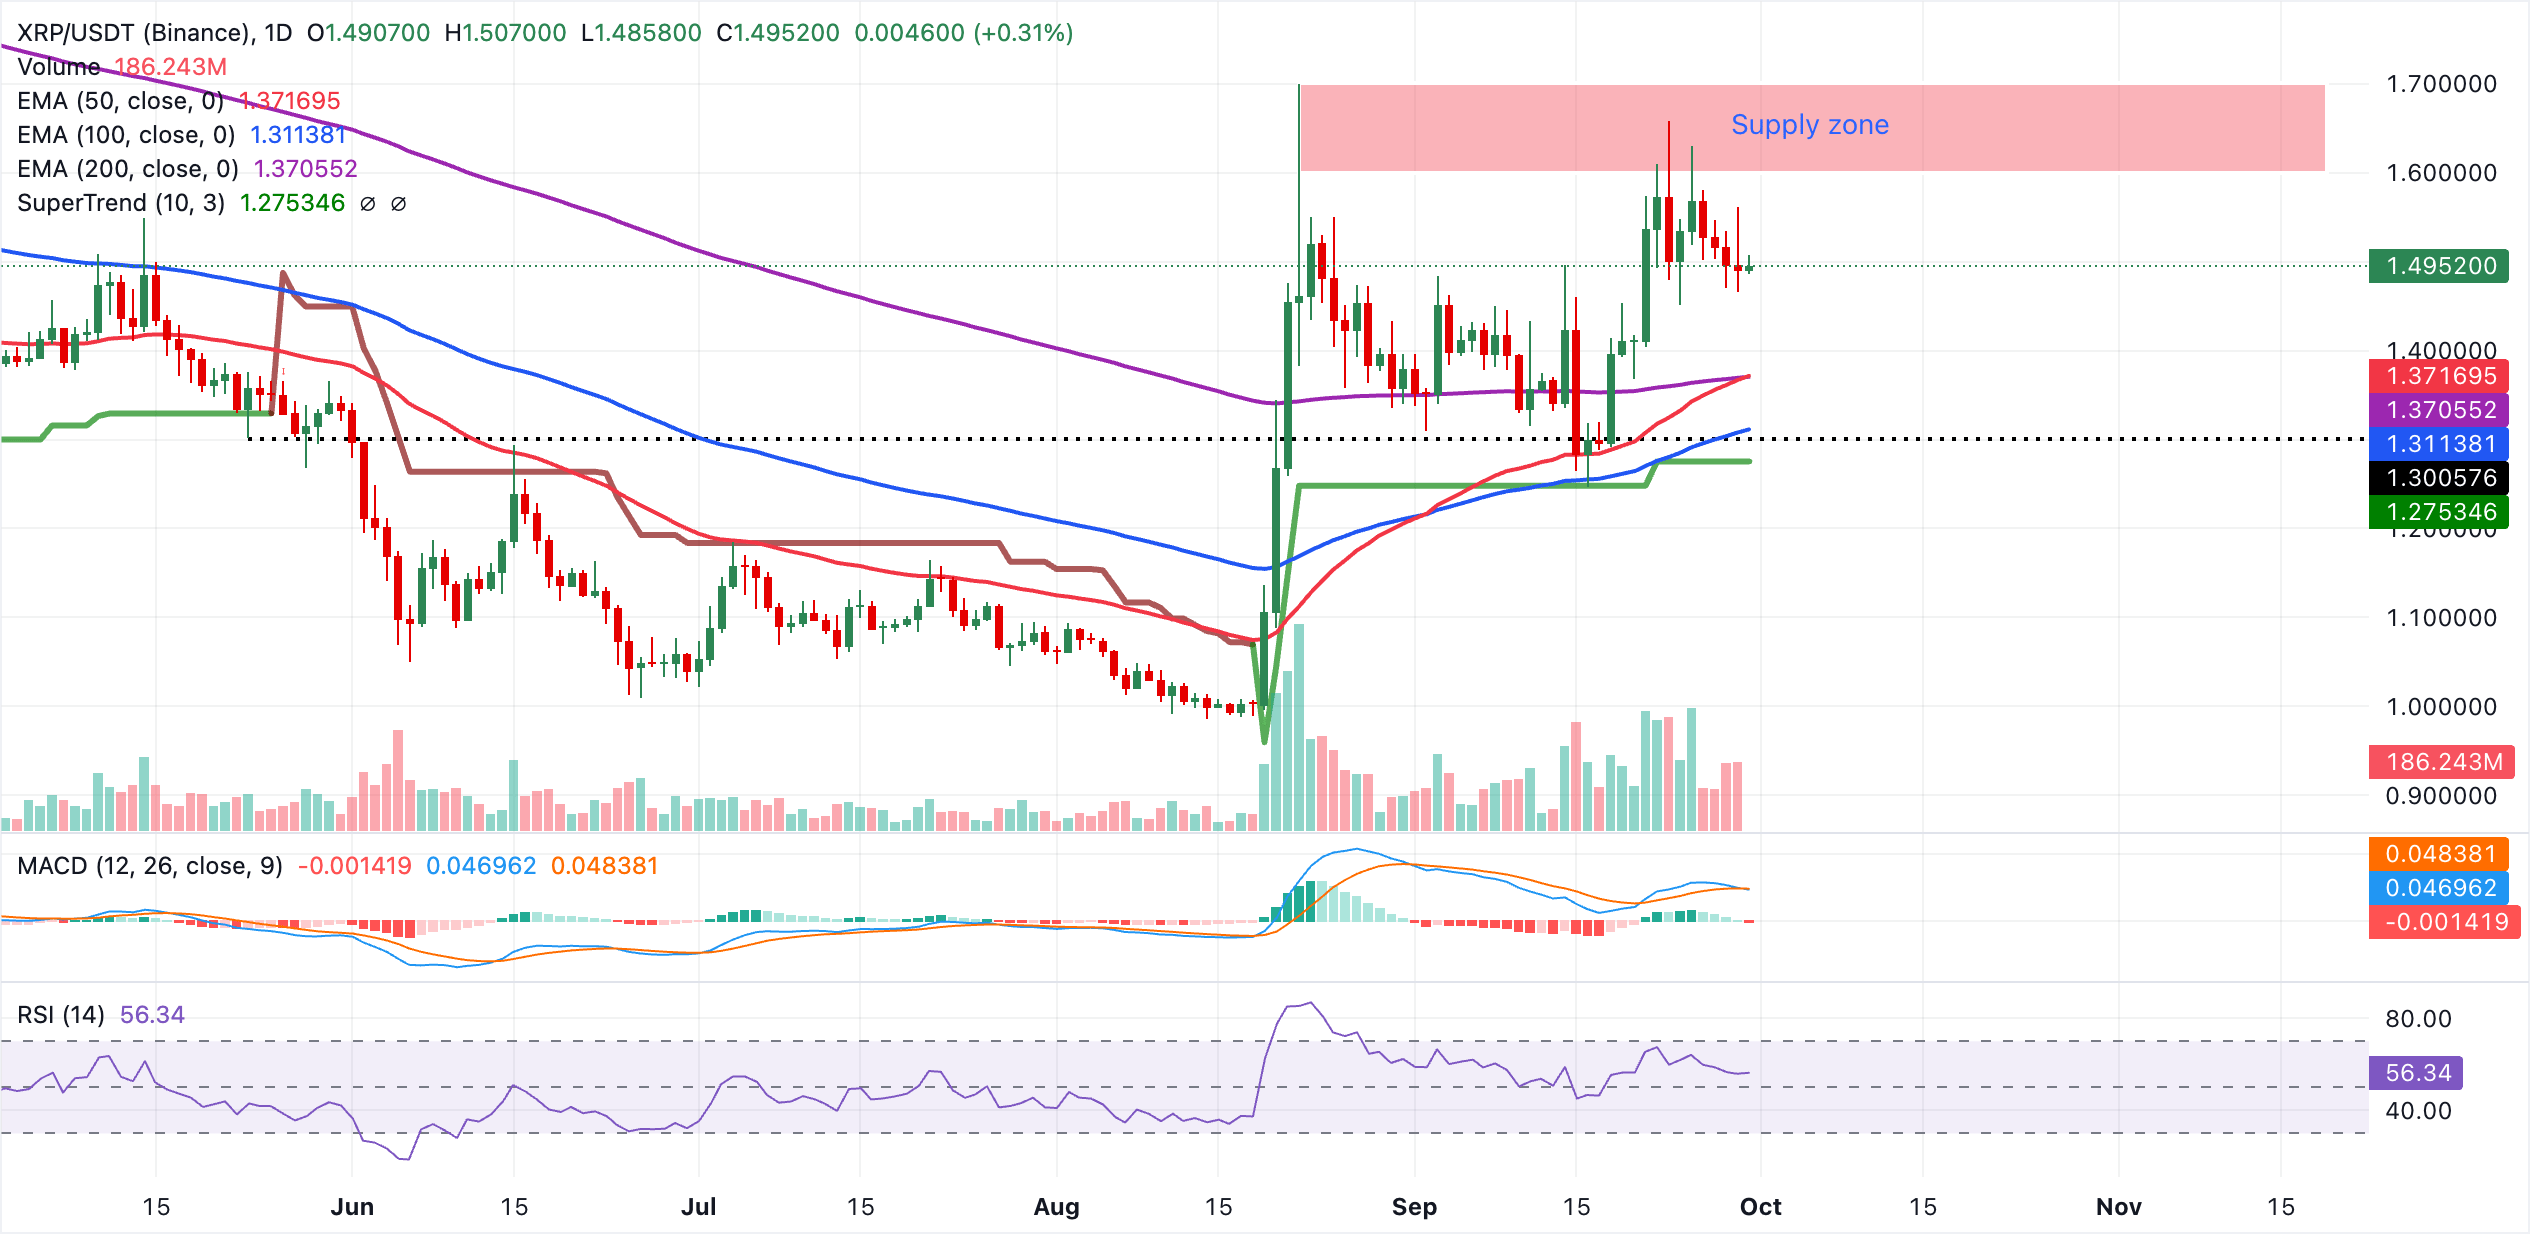
On the downside, initial support lies at the 50-day EMA at $1.37, closely backed by the 200-day EMA at $1.37, forming a dense technical floor should price retreat from current levels. Deeper pullbacks would expose the 100-day EMA at $1.31 before the SuperTrend line at $1.28, which marks a more distant but still relevant bullish pivot. With price trading comfortably above all these levels, the pair retains a bullish near-term bias as long as it holds above the $1.37 area.
(The technical analysis of this story was written with the help of an AI tool. Know more.)
Bitcoin, altcoins, stablecoins FAQs
Bitcoin is the largest cryptocurrency by market capitalization, a virtual currency designed to serve as money. This form of payment cannot be controlled by any one person, group, or entity, which eliminates the need for third-party participation during financial transactions.
Altcoins are any cryptocurrency apart from Bitcoin, but some also regard Ethereum as a non-altcoin because it is from these two cryptocurrencies that forking happens. If this is true, then Litecoin is the first altcoin, forked from the Bitcoin protocol and, therefore, an “improved” version of it.
Stablecoins are cryptocurrencies designed to have a stable price, with their value backed by a reserve of the asset it represents. To achieve this, the value of any one stablecoin is pegged to a commodity or financial instrument, such as the US Dollar (USD), with its supply regulated by an algorithm or demand. The main goal of stablecoins is to provide an on/off-ramp for investors willing to trade and invest in cryptocurrencies. Stablecoins also allow investors to store value since cryptocurrencies, in general, are subject to volatility.
Bitcoin dominance is the ratio of Bitcoin's market capitalization to the total market capitalization of all cryptocurrencies combined. It provides a clear picture of Bitcoin’s interest among investors. A high BTC dominance typically happens before and during a bull run, in which investors resort to investing in relatively stable and high market capitalization cryptocurrency like Bitcoin. A drop in BTC dominance usually means that investors are moving their capital and/or profits to altcoins in a quest for higher returns, which usually triggers an explosion of altcoin rallies.
Recommended Articles


