

Pi Network Price Forecast: PI tests 50-day EMA breakout as market hype builds

Source Fxstreet
  • Pi Network ticks higher on Wednesday, hovering above $0.0910 after a bullish close the previous day.
  • A steady increase in PI futures Open Interest points to firm derivatives demand as the broader cryptocurrency market maintains a risk-on sentiment.
  • The technical outlook for PI shows a near-term upside bias, with bulls testing the 50-day EMA breakout.

Pi Network (PI) edges above $0.0910 at press time on Wednesday, advancing the mild recovery from the previous day. The PI futures Open Interest shows a positional buildup, possibly supporting a rebound amid broader market risk-on sentiment. The technical outlook for PI indicates a mild bullish bias as the near-term recovery tests the 50-day Exponential Moving Average (EMA) breakout at $0.0917.

Retail speculations hold firm amid broader market risk-on sentiment

Pi Network builds retail strength as investors' risk appetite remains elevated. CoinAnk data shows the PI futures Open Interest (OI) stands at $10.57 million on Wednesday, up from $10.05 million the previous day, suggesting an increase in the notional value of all active contracts. 
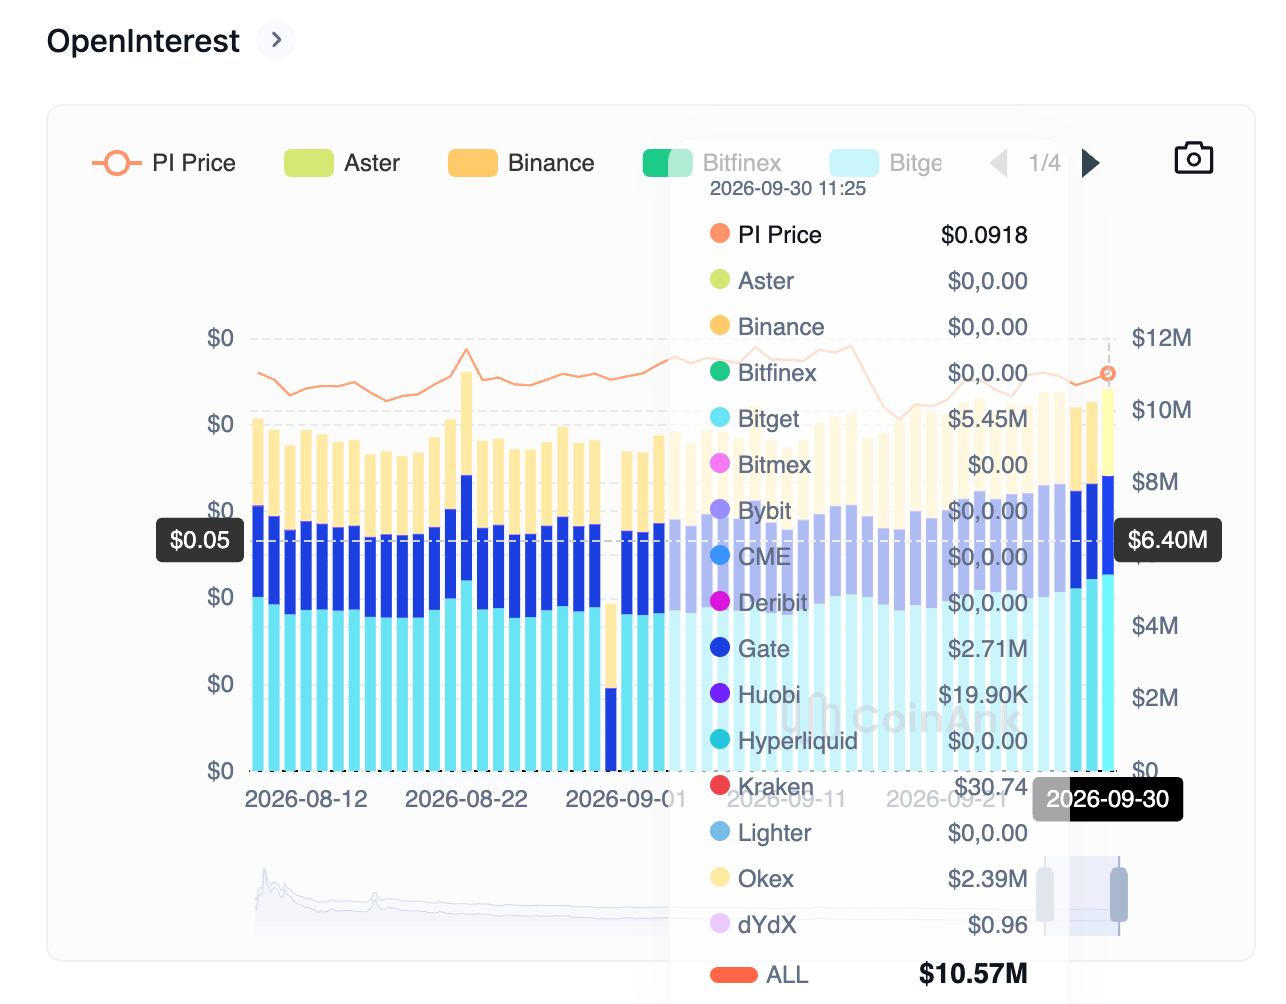
PI token Open Interest chart. Source: CoinAnk

At the same time, CoinMarketCap’s Fear and Greed Index stands at 67, continuing its decline from 74 last week. Still, the indicators suggest elevated risk appetite as it rests well above the upper band of the neutral range at 60.
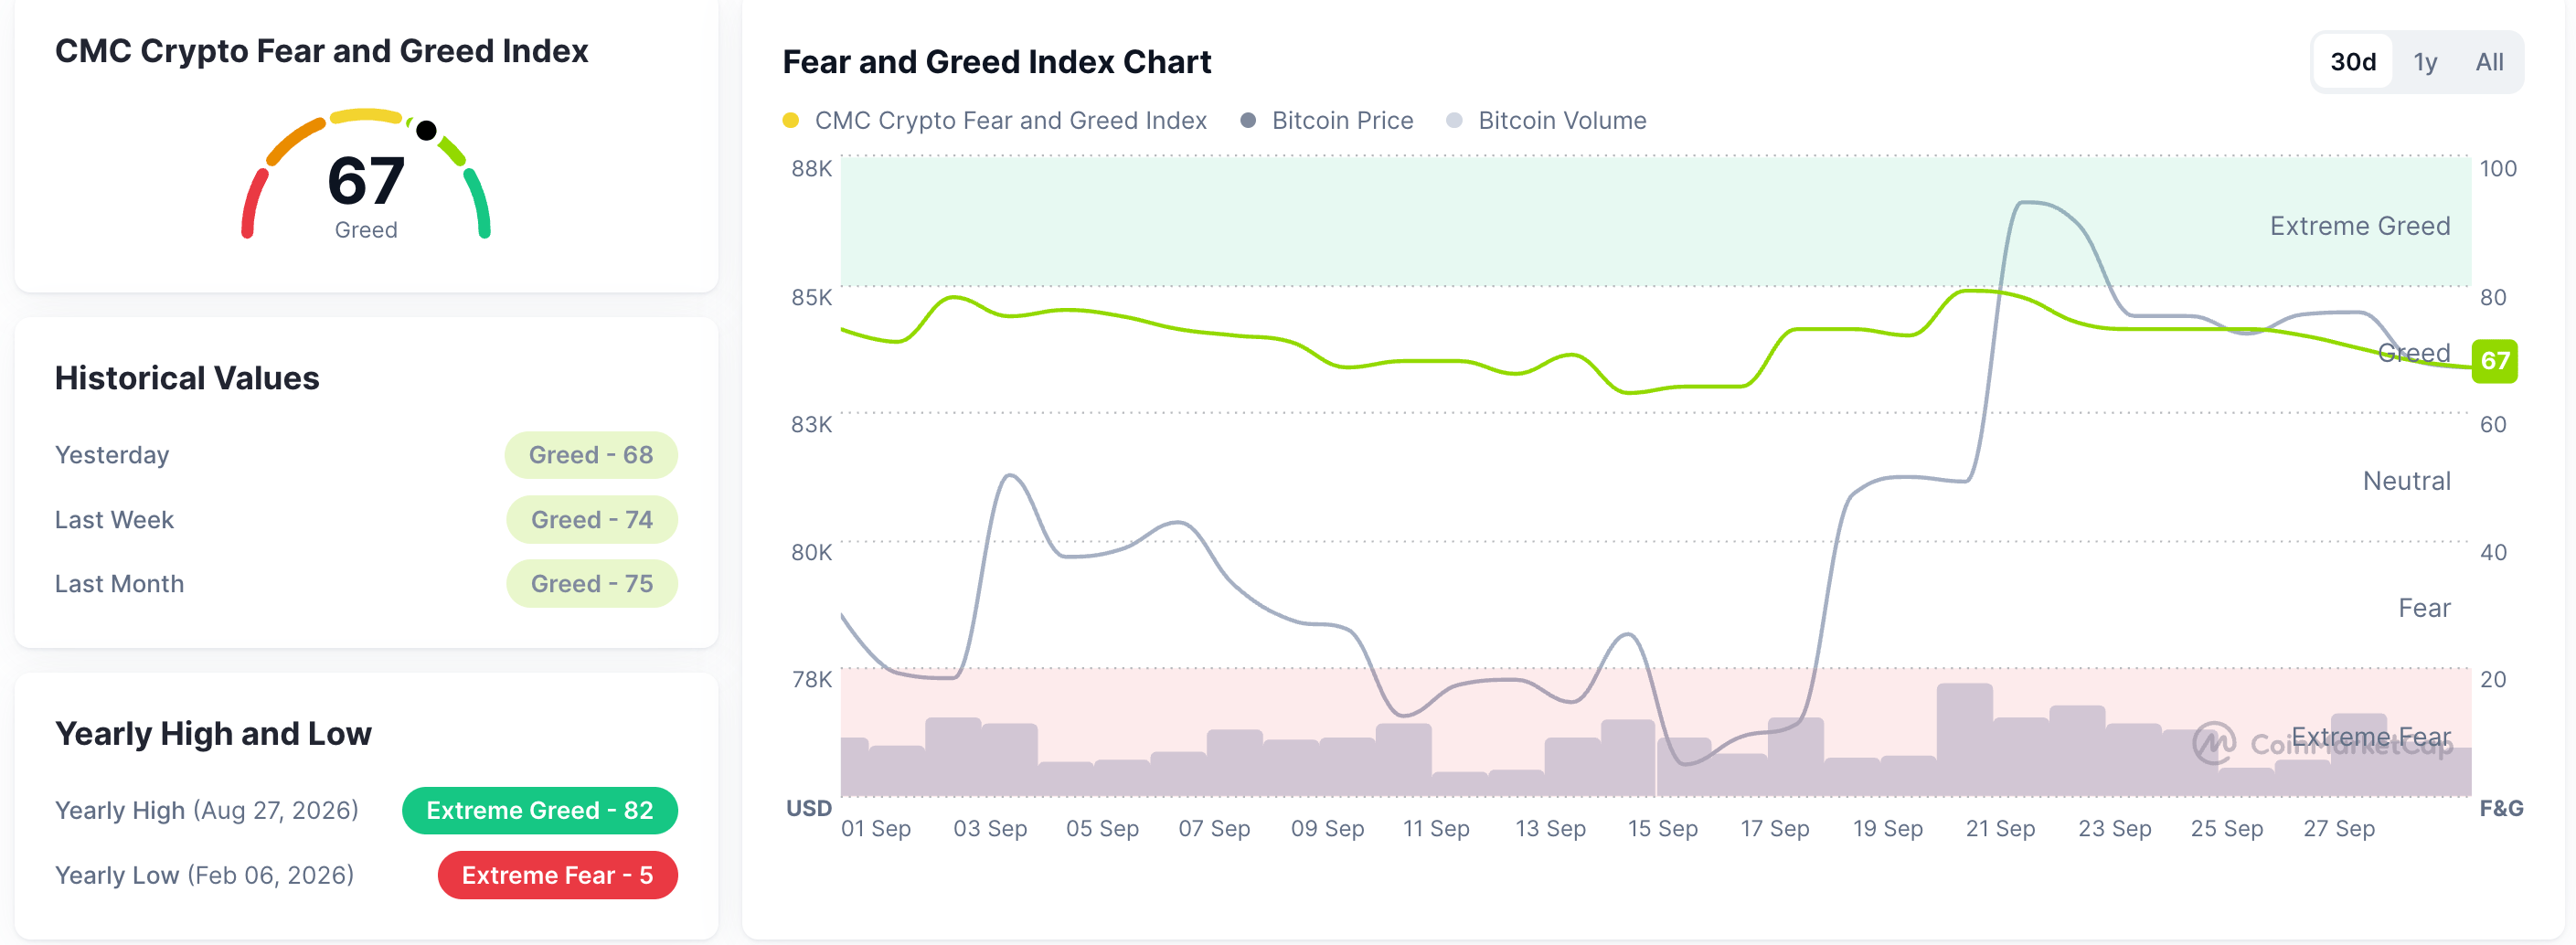
Fear and Greed Index. Source: CoinMarketCap

Technical outlook: Pi Network recovery eyes 50-day EMA breakout

Pi trades at $0.0918 at press time on Wednesday, extending its mild gains from the previous day. Still, the PI token maintains a near-term bearish bias as it tests the breakout of the 50-day EMA at $0.0917 and sits well below the 100- and 200-day EMAs at $0.1002 and $0.1235, respectively.

A confirmed breakout above the 50-day EMA could target the overhead resistance cluster formed by the 50% retracement level of the downswing from $0.1341 to $0.0704 at $0.0990 and the 100-day EMA at $0.1002.

Momentum on the daily chart remains mostly neutral, with the Relative Strength Index (RSI) at 52, rising above the midline, while the Moving Average Convergence Divergence (MACD) remains in the negative territory but holds marginally above its signal line.

Chart Analysis PI/USD (baha Crypto)
PI/USD daily price chart.

Looking down, a potential reversal from the 50-day EMA could test the 23.6% Fibonacci retracement level at $0.0827, reinforced by the July 31 low at $0.0801. Any deeper pullbacks could likely test the all-time low of $0.0704.

(The technical analysis of this story was written with the help of an AI tool. Know more.)

Disclaimer: For information purposes only. Past performance is not indicative of future results.
placeholder
October hike odds climb toward 60% as Goldman and BofA both flip — what Warsh's "dose of accommodation" really changedRate futures now price roughly 55% to 62% for a 25bp hike at the October 27-28 FOMC, up from about 30% before Chair Warsh's post-meeting framing that the Fed is merely "removing some accommodation." Goldman Sachs has added an October hike to its forecast and Bank of America now sees moves in both October and December. Here is the repricing, the language behind it, and the two data points that decide it.
Author  Irene Q.
Sep 23, Wed
Rate futures now price roughly 55% to 62% for a 25bp hike at the October 27-28 FOMC, up from about 30% before Chair Warsh's post-meeting framing that the Fed is merely "removing some accommodation." Goldman Sachs has added an October hike to its forecast and Bank of America now sees moves in both October and December. Here is the repricing, the language behind it, and the two data points that decide it.
placeholder
Four jobs reports in five days: what JOLTS, ADP, claims and the September payrolls mean for the October Fed decisionThe US labour market faces its densest data week of the month. JOLTS job openings land Tuesday (7.2 million expected), ADP on Wednesday (70,000 expected), initial claims on Thursday and the September non-farm payrolls on Friday (100,000 expected, down from 162,000). Markets price a 64%-70% chance of another quarter-point Fed hike on October 28. The dollar index sits at 100.77 and the S&P 500 at 7,729.8.
Author  Mitrade
Sep 28, Mon
The US labour market faces its densest data week of the month. JOLTS job openings land Tuesday (7.2 million expected), ADP on Wednesday (70,000 expected), initial claims on Thursday and the September non-farm payrolls on Friday (100,000 expected, down from 162,000). Markets price a 64%-70% chance of another quarter-point Fed hike on October 28. The dollar index sits at 100.77 and the S&P 500 at 7,729.8.
placeholder
Nvidia's $150 billion buyback landed — and the AI sector fell anyway. That's the signal worth tradingNvidia closed up 1.68% at $228.86 on 28 September after announcing a $150 billion share repurchase authorisation, the largest single corporate buyback on record, while the rest of the AI complex sold off: AMD -3.6%, Micron -2.6%, Meta -4.8% and the Philadelphia Semiconductor Index -1.61%. The divergence is not noise. Capital is rotating toward cash-flow certainty, not abandoning the AI theme. With Micron reporting after the close on 30 September, here is what the split means.
Author  Irene Q.
Yesterday 06: 31
Nvidia closed up 1.68% at $228.86 on 28 September after announcing a $150 billion share repurchase authorisation, the largest single corporate buyback on record, while the rest of the AI complex sold off: AMD -3.6%, Micron -2.6%, Meta -4.8% and the Philadelphia Semiconductor Index -1.61%. The divergence is not noise. Capital is rotating toward cash-flow certainty, not abandoning the AI theme. With Micron reporting after the close on 30 September, here is what the split means.
placeholder
The 30-year Treasury just hit a 22-year high — and the bond market is not pricing the Fed, it is pricing the deficitThe 30-year Treasury yield closed at 5.56% on 28 September, the highest since June 2004, while the 10-year reached 5.24% and the 20-year 5.60%. The curve has steepened roughly 30bp in eight sessions even as October hike odds sit at 70.3%. That gap is the story: the long end is repricing fiscal and inflation risk, not policy. With PCE on Wednesday and payrolls on Friday, here is what the long end is really saying.
Author  Irene Q.
Yesterday 07: 08
The 30-year Treasury yield closed at 5.56% on 28 September, the highest since June 2004, while the 10-year reached 5.24% and the 20-year 5.60%. The curve has steepened roughly 30bp in eight sessions even as October hike odds sit at 70.3%. That gap is the story: the long end is repricing fiscal and inflation risk, not policy. With PCE on Wednesday and payrolls on Friday, here is what the long end is really saying.
placeholder
【Daily Brief】30-year Treasury tops 5.59%, S&P 500 slips to 7,670 and gold holds $4,180 — PCE lands tonightThe 30-year Treasury yield closed at 5.59%, its highest since June 2002, and the Dow fell 131.59 points to 51,349.92. US consumer confidence dropped to 81.9, a 12-year low, and JOLTS job openings fell to 7.1 million. August PCE and Q3 GDP both land at 8:30am ET tonight.
Author  Suzie
6 hours ago
The 30-year Treasury yield closed at 5.59%, its highest since June 2002, and the Dow fell 131.59 points to 51,349.92. US consumer confidence dropped to 81.9, a 12-year low, and JOLTS job openings fell to 7.1 million. August PCE and Q3 GDP both land at 8:30am ET tonight.
goTop
quote