

Dogecoin Price Forecast: Extends gains as ETF inflows return and momentum improves

Source Fxstreet
  • Dogecoin trades above $0.088 on Monday, having rallied nearly 6% last week.
  • US-listed spot ETFs recorded $284,510 in inflows last week after remaining muted in mid-September.
  • Improving momentum indicators, along with certain whale accumulations, suggest a bullish bias.

Dogecoin (DOGE) extends its recovery, trading above $0.088 on Monday after gaining nearly 6% last week. The bullish price outlook is supported by the return of institutional demand through DOGE spot Exchange Traded Funds (ETFs). Meanwhile, improving momentum indicators and signs of whale accumulation suggest a positive outlook for the dog-themed meme coin.

Institutional demand returns

SoSoValue data showed that spot DOGE ETFs recorded an inflow of $284,510 last week after remaining muted in mid-September.

These mild inflows suggest early signs of returning institutional demand after a quiet period, but they also indicate investors remain cautious. Moreover, if the inflows continue and intensify this week, they could provide additional support for DOGE and strengthen its recovery momentum.
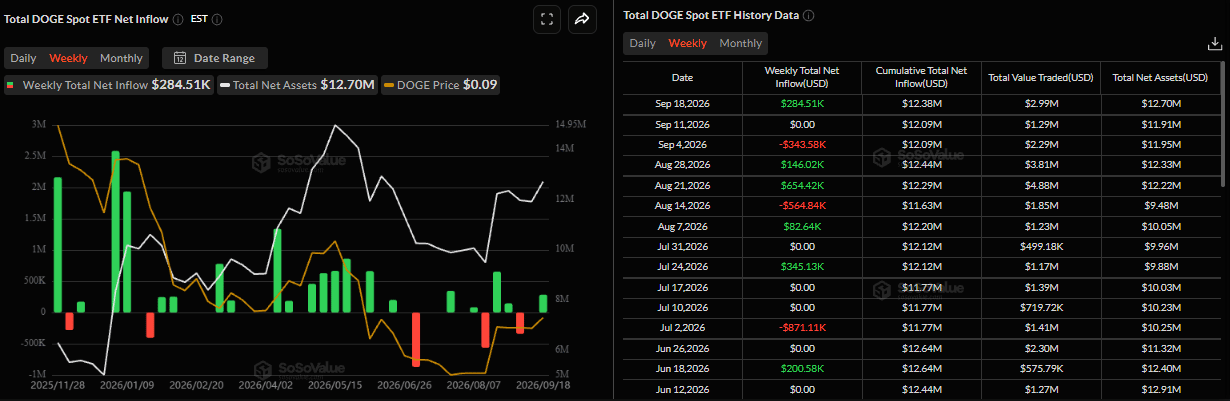
Total DOGE spot ETF net inflow weekly chart. Source: SoSoValue

Whales buying DOGE 

Santiment’s Supply Distribution data shows certain large-wallet holders (whales) buying DOGE meme coins, supporting a positive outlook for the token.

The metric indicates that whales holding between 10 million and 100 million DOGE tokens (blue line) and 100,000 and 1 million DOGE tokens have accumulated 120 million dog-themed meme coins since Thursday. During the same period, 1 million and 10 million (yellow line) have shed 90 million tokens. This indicates that accumulation among larger and smaller whale cohorts has outweighed selling from the mid-sized cohort, suggesting a mixed but broadly supportive accumulation trend for DOGE.

Dogecoin supply distribution metric chart. Source: Santiment

Some signs of concerns

CryptoQuant’s summary data shows mildly cautious signs. DOGE’s futures markets show large whale orders; however, it also shows sell-side dominance. In addition, spot markets show heating conditions while other metrics remain neutral, highlighting a mildly bearish, cautious sentiment bias among the meme coin traders.
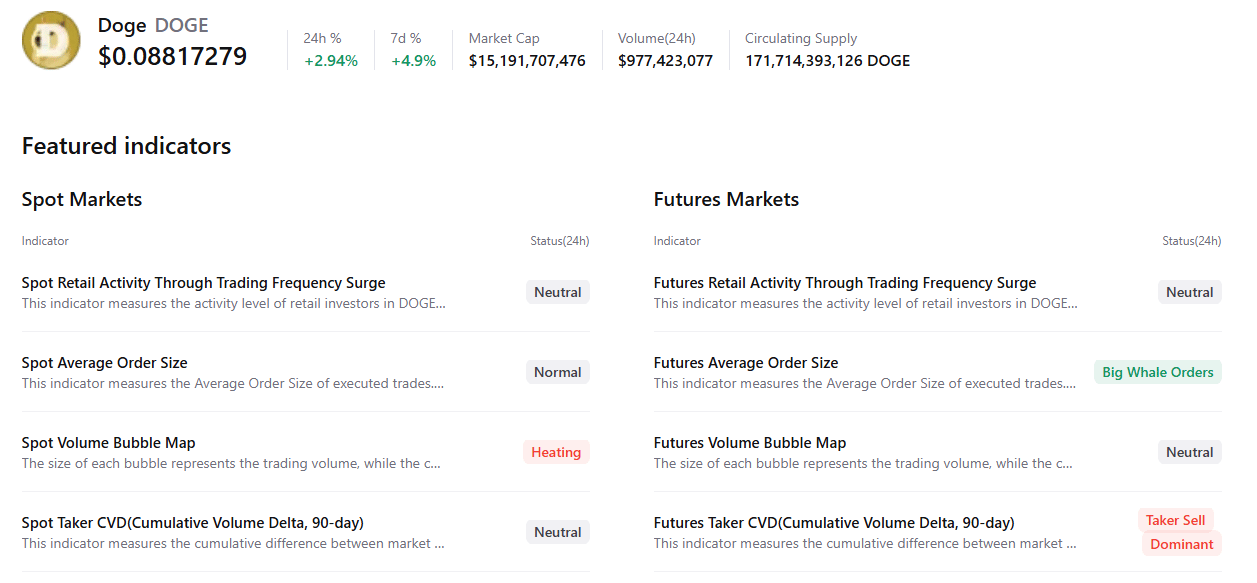
Dogecoin summary chart. Source: CryptoQuant

Dogecoin technical outlook: Rebounds from strong support zone

Dogecoin price trades at $0.088 on Monday after gaining nearly 6% last week. DOGE maintains a mildly bullish outlook as it holds above the 50-day and 100-day Exponential Moving Averages (EMAs) at roughly $0.082, but remains clearly below the 200-day EMA near $0.093. 

This setup suggests an improving medium-term base within a broader corrective context, with the Relative Strength Index (RSI) hovering in the mid-50s and the Moving Average Convergence Divergence (MACD) fluctuating around the zero line, hinting at waning upside momentum as price hesitates under the longer-term trend gauge.

On the topside, immediate resistance aligns with the recent horizontal cap at $0.088, with the 200-day EMA at $0.093 as the next key barrier before a more substantial hurdle at the prior horizontal resistance around $0.102.

On the downside, initial support comes from the 100-day EMA and the 50-day EMA roughly around $0.082. At the same time, a deeper pullback would expose the horizontal floor near $0.070, which buyers would need to defend to preserve the nascent basing structure.
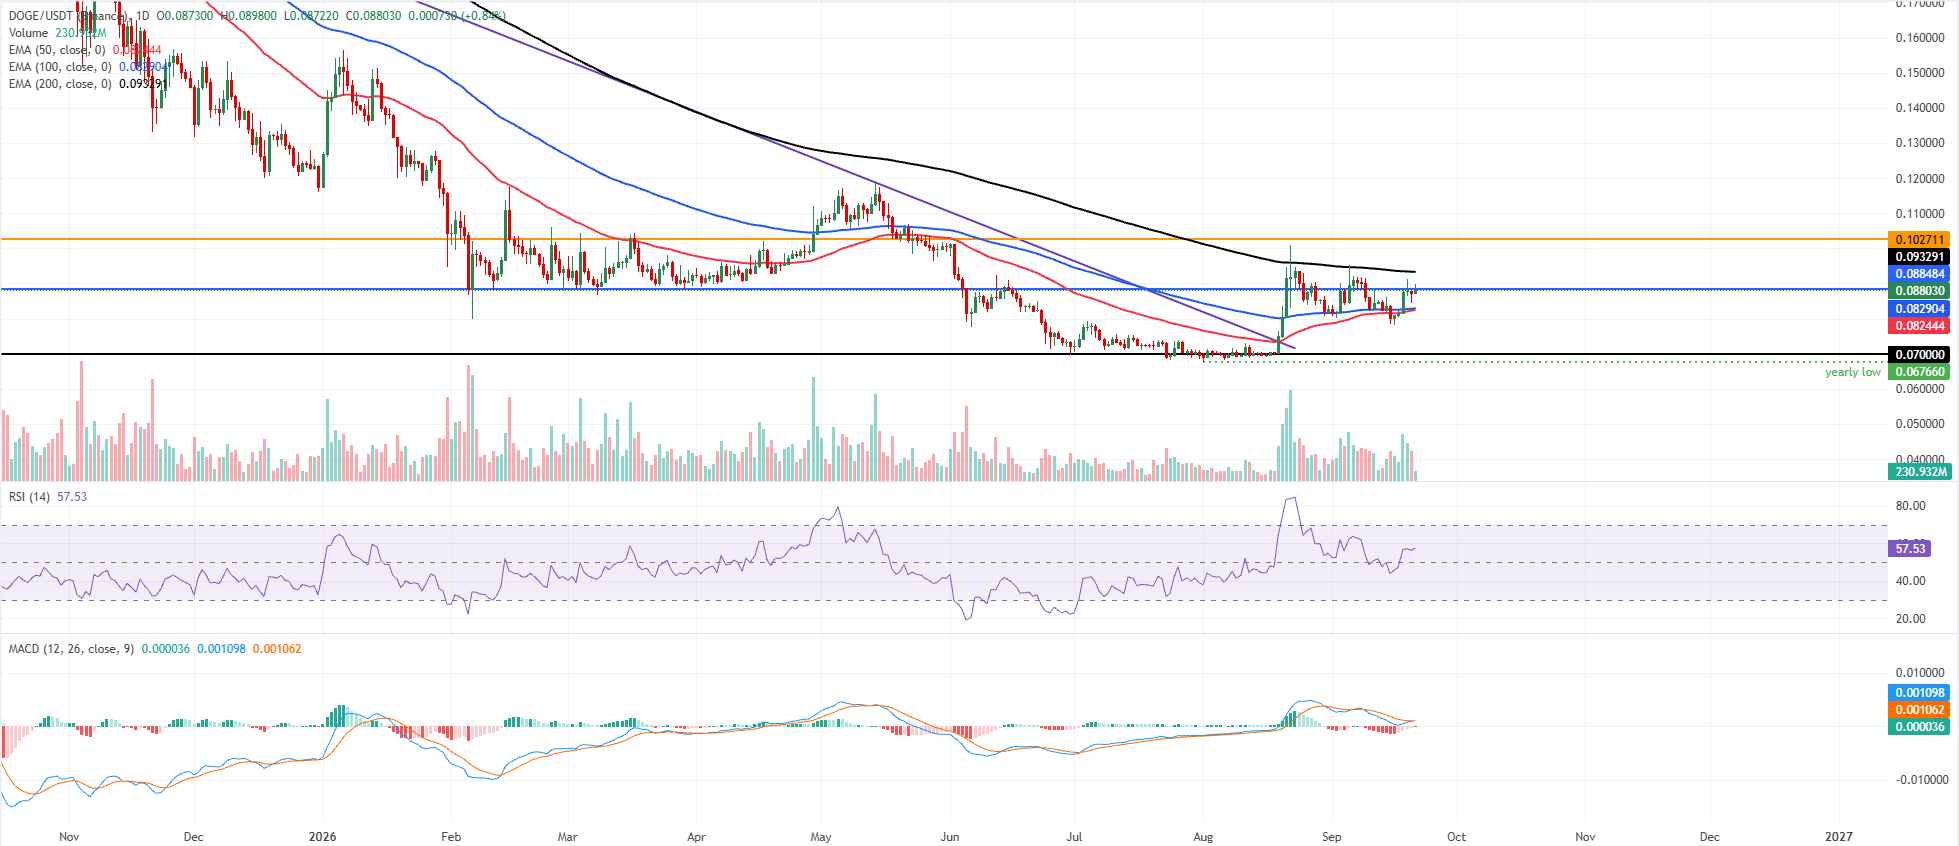
DOGE/USDT daily chart

(The technical analysis of this story was written with the help of an AI tool. Know more.)

Disclaimer: For information purposes only. Past performance is not indicative of future results.
placeholder
Bitcoin falls below $75,000 as the CLARITY Act fails in the Senate — what the vote means for cryptoThe US Senate blocked the Digital Asset Market CLARITY Act in a 49-50 procedural vote, sending Bitcoin briefly below $75,000 — its biggest one-day drop since June. Ethereum fell more than 8%, Coinbase slid 10% and $75 billion of crypto market value evaporated. Here is what the vote was, why it failed, and the levels that matter now.
Author  Suzie
Sep 16, Wed
The US Senate blocked the Digital Asset Market CLARITY Act in a 49-50 procedural vote, sending Bitcoin briefly below $75,000 — its biggest one-day drop since June. Ethereum fell more than 8%, Coinbase slid 10% and $75 billion of crypto market value evaporated. Here is what the vote was, why it failed, and the levels that matter now.
placeholder
Dollar index tops 100 for the first time since July as the Fed's hawkish dot plot sinks inThe U.S. dollar index broke back above 100 for the first time since 31 July after the Fed delivered its first rate hike since 2023, with the dot plot showing 16 of 18 officials expect at least one more increase this year. Here are the levels that matter for DXY, the currencies feeling it most, and what to watch next.
Author  Irene Q.
Sep 17, Thu
The U.S. dollar index broke back above 100 for the first time since 31 July after the Fed delivered its first rate hike since 2023, with the dot plot showing 16 of 18 officials expect at least one more increase this year. Here are the levels that matter for DXY, the currencies feeling it most, and what to watch next.
placeholder
Gold ends three-week slide at the $4,400 line — eight straight days of ETF inflows vs a 5% 10-year and a 100 dollarSpot gold closed Friday at $4,378.39, up 0.84% on the day and about 0.8% for the week — its first weekly gain in four weeks — with the intraday high of $4,399.67 leaving it 33 cents shy of the $4,400 line. Gold ETFs have now logged eight straight sessions of inflows, but with the 10-year back above 5% and the dollar index near 100, here is what decides whether this is a reversal or a bounce.
Author  Suzie
Sep 20, Sun
Spot gold closed Friday at $4,378.39, up 0.84% on the day and about 0.8% for the week — its first weekly gain in four weeks — with the intraday high of $4,399.67 leaving it 33 cents shy of the $4,400 line. Gold ETFs have now logged eight straight sessions of inflows, but with the 10-year back above 5% and the dollar index near 100, here is what decides whether this is a reversal or a bounce.
placeholder
Gold Price Forecast: Gold Eyes Key $4,400 Resistance as Falling Oil Prices Ease Inflation PressureAs of the Asian session on September 21, gold prices (XAUUSD) maintained high-level consolidation intraday today following a strong rebound last week, with the latest price trading around
Author  TradingKey
Sep 21, Mon
As of the Asian session on September 21, gold prices (XAUUSD) maintained high-level consolidation intraday today following a strong rebound last week, with the latest price trading around
placeholder
Dollar holds above 100 near a 3-month high — three Fed speakers and a $69 billion auction land tonightThe dollar index closed at 100.43 on Monday, its highest close since late July, after a weekly gain of about 1% — the best in more than three months — and is holding above the 100.00 handle in Asia. Three Fed officials speak tonight alongside a $69 billion two-year note auction, the first leg of $183 billion of Treasury supply this week.
Author  Suzie
19 hours ago
The dollar index closed at 100.43 on Monday, its highest close since late July, after a weekly gain of about 1% — the best in more than three months — and is holding above the 100.00 handle in Asia. Three Fed officials speak tonight alongside a $69 billion two-year note auction, the first leg of $183 billion of Treasury supply this week.
Related Instrument
goTop
quote