


XRP Price Prediction: Can It Reach $10 by 2030?
How Has XRP's Price Trended Over the Past Five Years?
TradingKey - Over the past five years, Ripple (XRP) has undergone nearly two full bull-bear cycles, in 2021 and 2025 respectively, with an interval of about four years; moreover, the bull market rally lasted only about six months, far shorter than the time consumed by the decline and consolidation in the bear market.
In January 2021, the price of XRP rose continuously from a low of $0.16 to $1.96 in April, achieving an 1,100% gain. Subsequently, XRP entered a bear market lasting over three years, fluctuating mainly in the range of $0.3-$0.5, with a maximum drawdown reaching 84%. At the end of 2024, the price of XRP broke through $1, completely ending its bear market consolidation and entering a new bull market. In July 2025, the price of XRP surged to $3.6, setting a new all-time high. Since then, the price of XRP has continued to fall, currently hovering around $1.
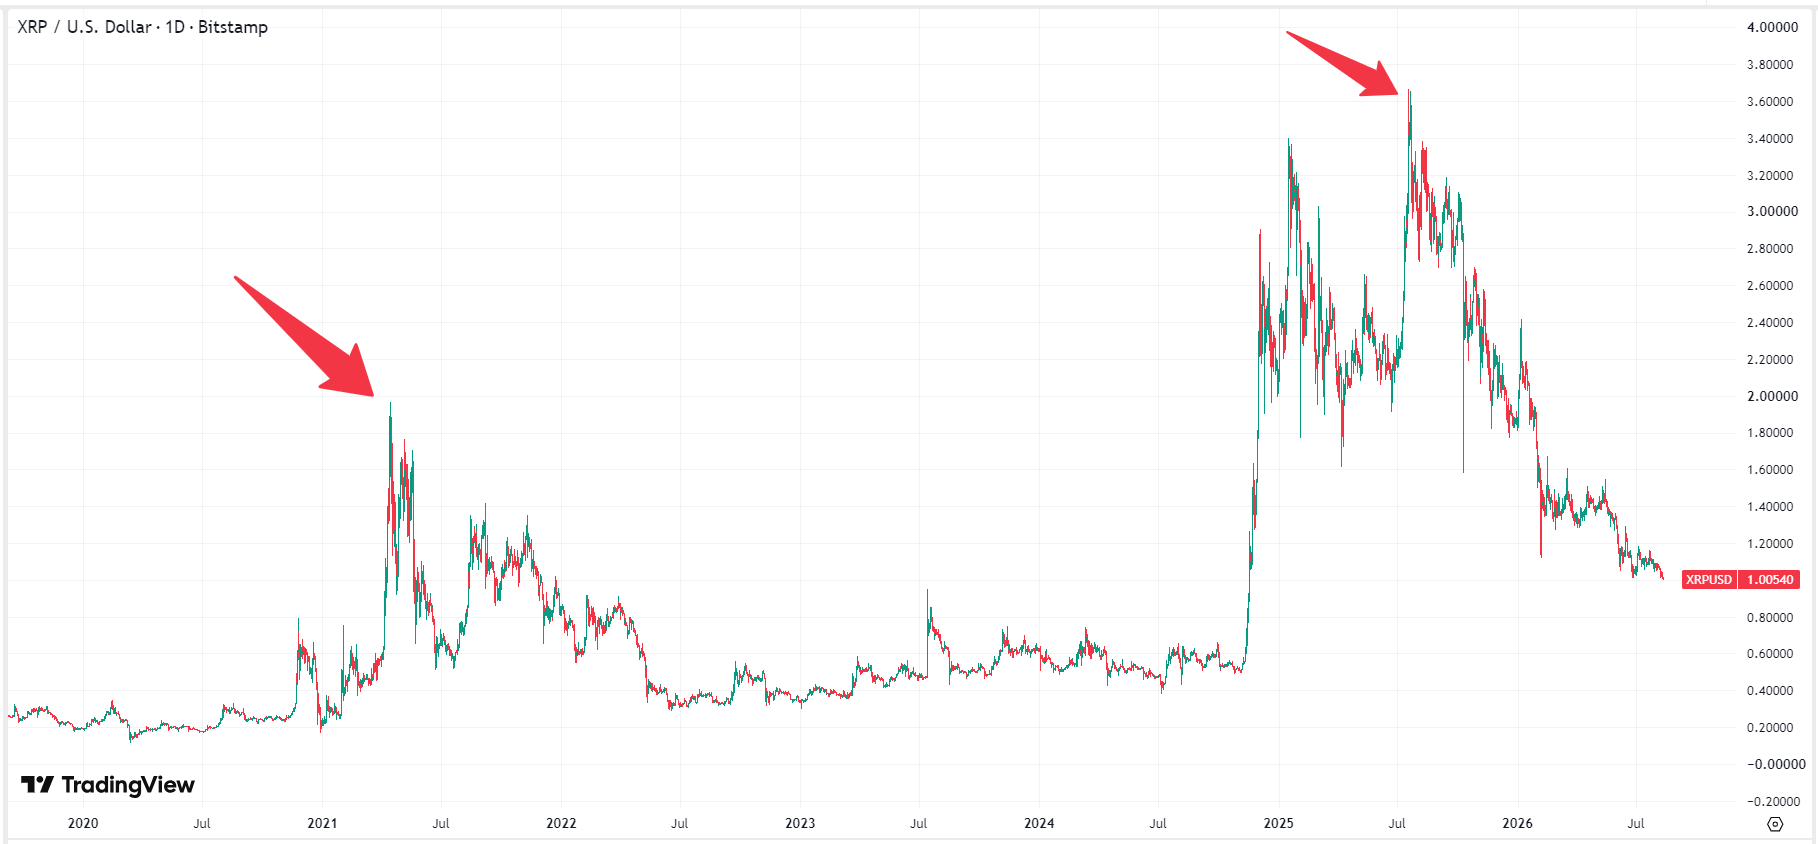 XRP price chart, Source: TradingView
What Factors Affect XRP Price Movements?
XRP's price action over the past five years has been highly dramatic, primarily driven by progress in the U.S. SEC lawsuit, bull-bear cycle transitions, institutional adoption, and ETF expectations.
Time | Core Drivers and Events |
2021 | Rallying alongside the bull market frenzy; explosive phase of the SEC lawsuit |
2022 | Broad bear-market deleveraging triggered by the collapses of FTX and LUNA |
2023 | The court ruled in July that retail XRP sales were not securities, triggering a brief rally |
2024 | Driven by the Bitcoin ETF effect; institutional capital returned following the clearance of regulatory risks |
2025 | Spot XRP ETF expectations, the launch of the RLUSD stablecoin, and full regulatory compliance |
2026 (To date) | Slowing global macro capital trading, with the price pulling back to the $1 psychological mark |
Will XRP Price Continue to Fall This Year?
Currently, the market is closely awaiting the Federal Reserve's (Fed) latest inflation (CPI) data and interest rate decision. Coupled with international geopolitical volatility, the broader cryptocurrency market has entered a short-term defensive wait-and-see phase. Spot XRP ETFs have seen no significant capital inflows, resulting in a lack of sustained marginal buying, and downside risks remain for the second half of the year.
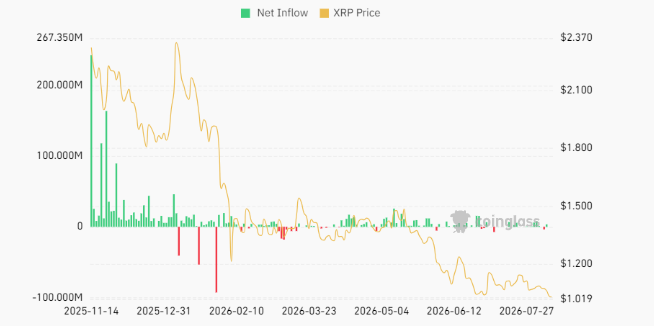 Spot XRP ETF capital flows, Source: Coinglass
XRP is currently hovering around $1. If the market is impacted by U.S. inflation data or macro liquidity tightening, causing a high-volume breakdown below this level in the short term, it could trigger stop-loss sell orders from quantitative strategies and programmatic trading, sending the price down to seek support at $0.50. This level marked the starting point of the previous bull market run and is viewed by technical analysts as a strong support level.
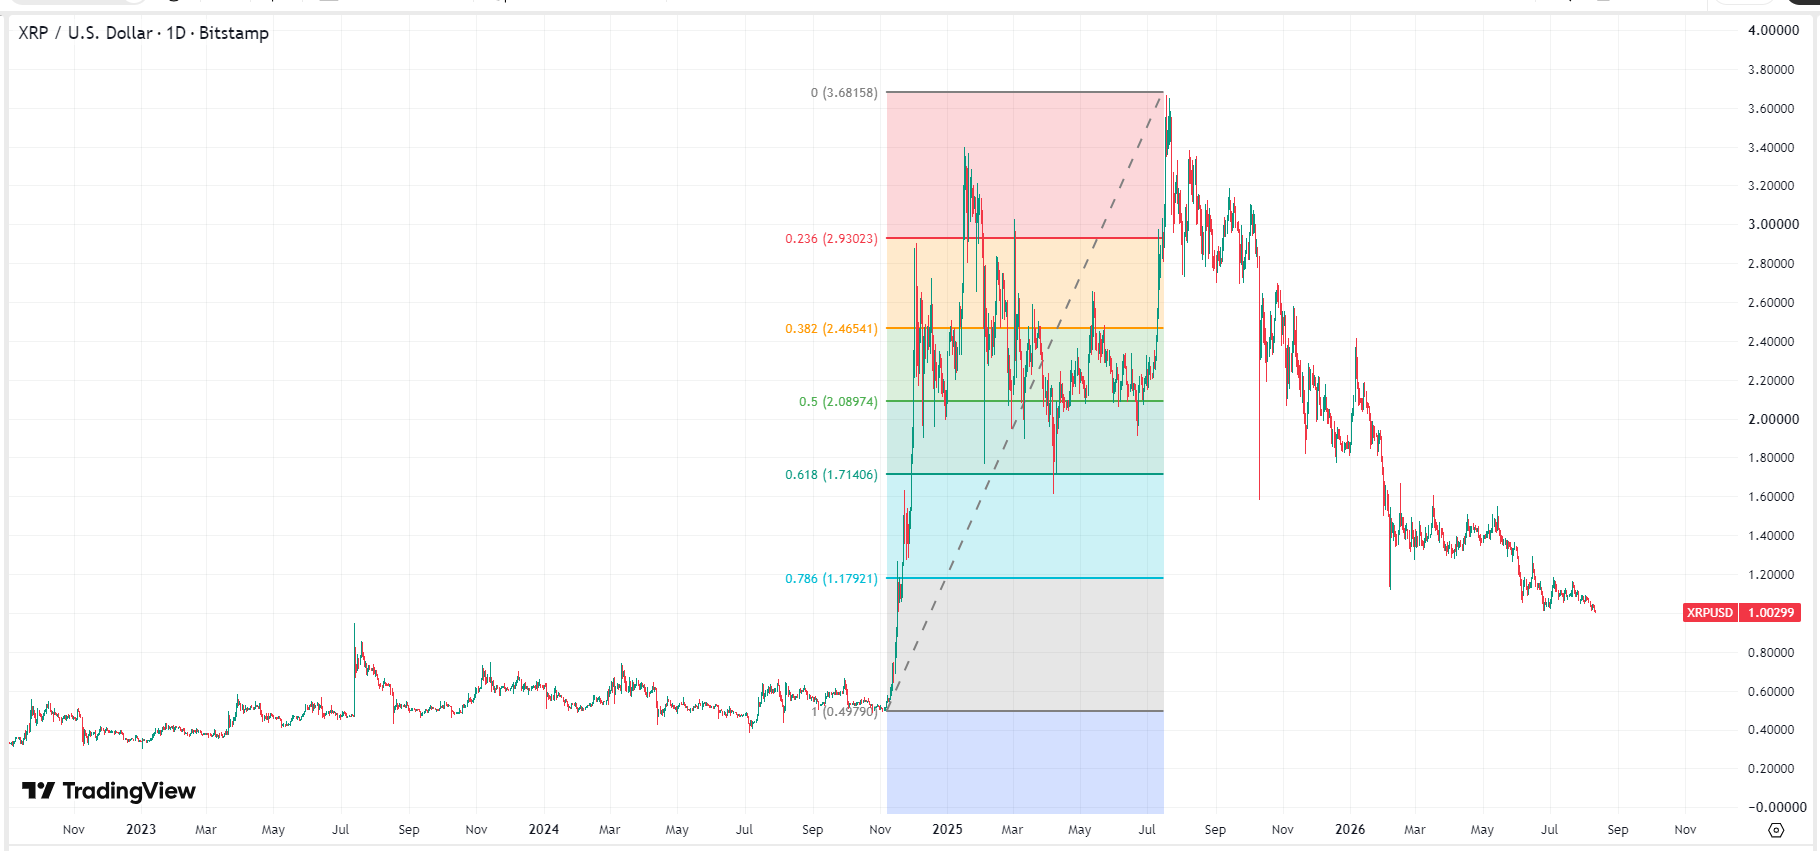 XRP price chart, Source: TradingView
Can XRP Break $10 in the Next Five Years?
Over the next five years, breaking through $10 is theoretically feasible for XRP. Historical data shows that the peak of a bull market is often higher than that of the previous one, typically double its level. With the peak in 2025 around $3.6, maintaining this multiple means achieving $10 is possible.
When XRP reaches $10, its circulating market capitalization will rise to $580 billion, while its fully diluted valuation (FDV) will reach $1 trillion. Supporting such a trillion-dollar market capitalization cannot be achieved by retail investors and community hype alone; it requires the long-term commitment of capital from global sovereign wealth funds, major traditional banks, and institutional ETFs. However, these require favorable catalysts, such as Ripple successfully capturing a 5%–10% market share of global interbank cross-border payments over the next five years, or a new round of global interest rate cuts and halving cycles driving the crypto market from 2028 to 2030.
Currently, some institutions believe XRP could achieve the $10 target or even rise higher before 2030, as outlined below:
Institution Name | Forecast Target Price | Core Valuation Logic and Key Drivers |
Standard Chartered | $12.25 | Following the resolution of the US SEC lawsuit, spot ETFs absorb substantial institutional capital; RippleNet successfully captures 3%–5% of global SWIFT cross-border settlement traffic. |
Bitwise | $12.68 – $29.32 | Large-scale adoption of XRP by the global banking industry as a bridge asset for instant liquidity. |
Valhil Capital | Over $10 | XRP completely frees up pre-funded Nostro/Vostro account funds for global banks, and its intrinsic value as a universal liquidity medium will far exceed $10. |
Conclusion
Over the past five years, Ripple (XRP) has gone through two bull-bear cycles. After rebounding from $0.16 to a 2025 high of $3.6, its price has pulled back to consolidate around $1. Affected by Federal Reserve policy, geopolitics, and slowing spot ETF inflows, a short-term break below $1 could lead to a test of the $0.5 support zone. Over the medium to long term, if it can expand its market share in cross-border payments and attract long-term institutional capital, it still has a chance to break through $10 over the next five years.
Recommended Articles


