

Solana Price Forecast: SOL nears triangle pattern breakout amid firm retail support

Source Fxstreet
  • Solana hovers around $75 on Friday, holding above a crucial support trendline despite easing bullish momentum.
  • SOL-focused ETFs with $403,890 in inflows on Thursday reflect easing institutional volatility earlier this week.
  • Retail demand holds firm with a positive funding rate and a mild contraction in SOL Open Interest.

Solana (SOL) is trading below $75.00 on Friday, testing a crucial support trendline of a symmetrical triangle pattern. SOL-focused Exchange Traded Funds (ETFs) recorded $403,890 in inflows on Thursday, while retail demand holds firm with rising funding rates. The technical outlook is mixed as SOL approaches a shift in bullish momentum. 

Rebound speculations rise despite mixed institutional interest

Solana is facing mixed institutional demand so far this week. SoSoValue data show that the SOL ETFs recorded $403,890 in inflows the previous day, following sharp fluctuations earlier this week. SOL ETFs recorded $18.07 million in outflows on Tuesday, which were later offset by $19.06 million in inflows on Wednesday. 

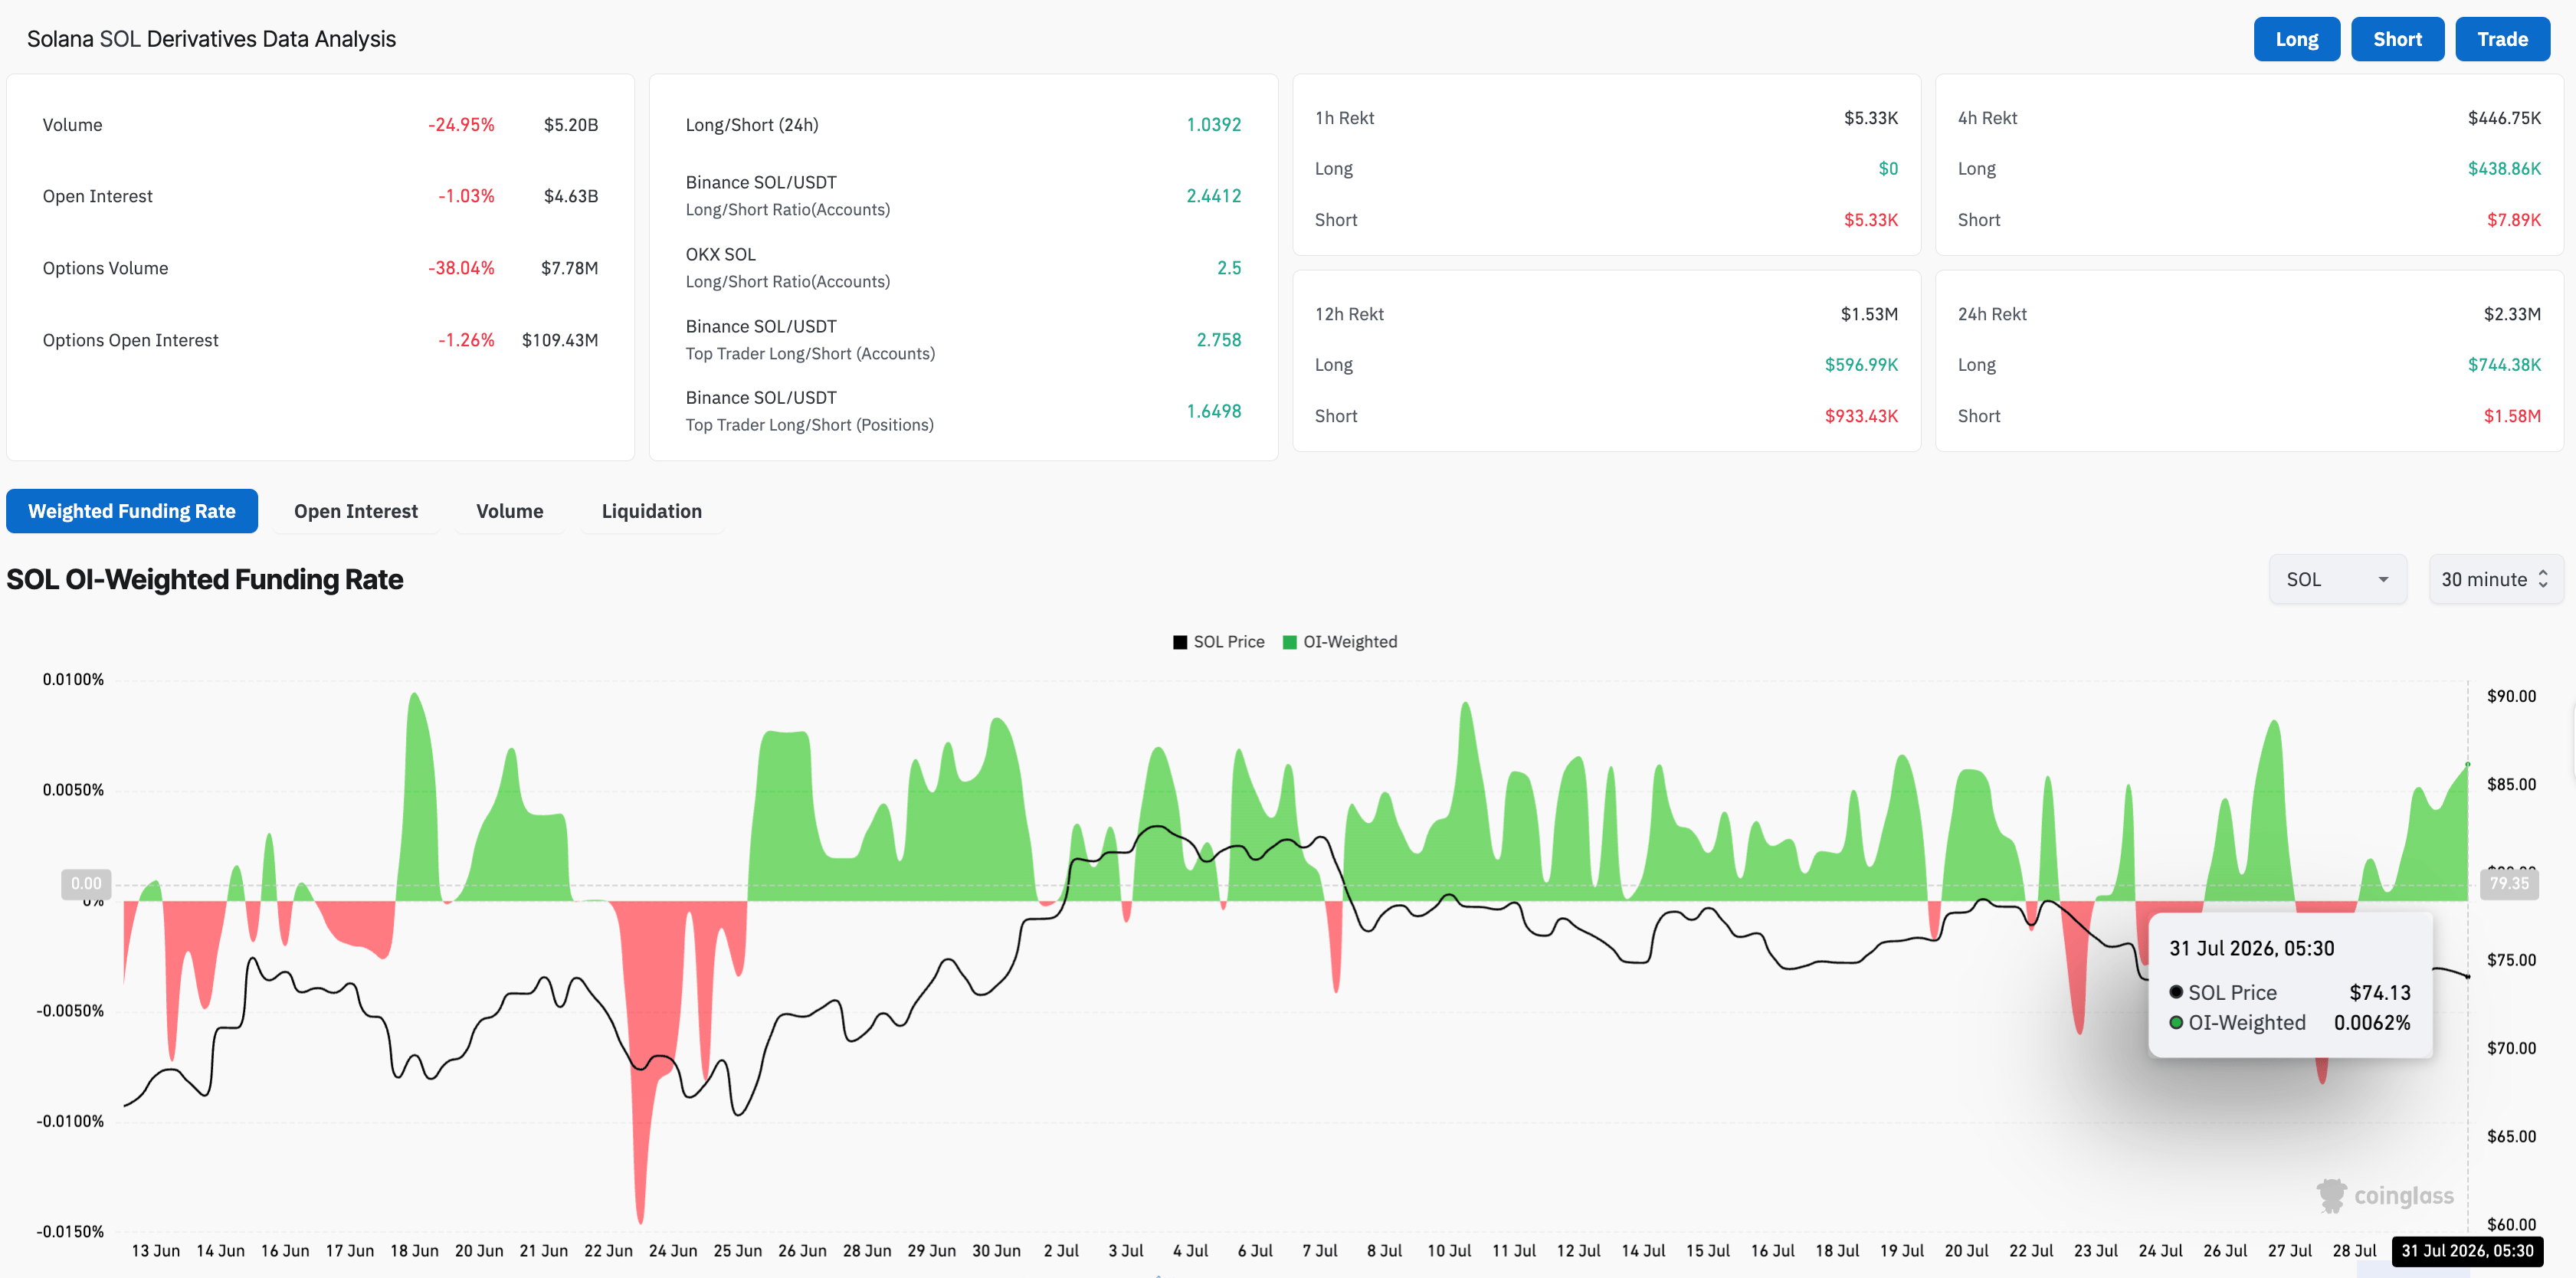
On the retail front, CoinGlass data shows the funding rate rose to 0.0062% on Friday, up from 0.0041% the previous day, signaling increased demand among buyers for long-position buildup. However, the roughly 25% decline in volume over the last 24 hours to $5.20 billion, combined with SOL futures Open Interest (OI) easing by around 1% to $4.36 billion, suggests reduced activity, while the notional value of active contracts remains stable.
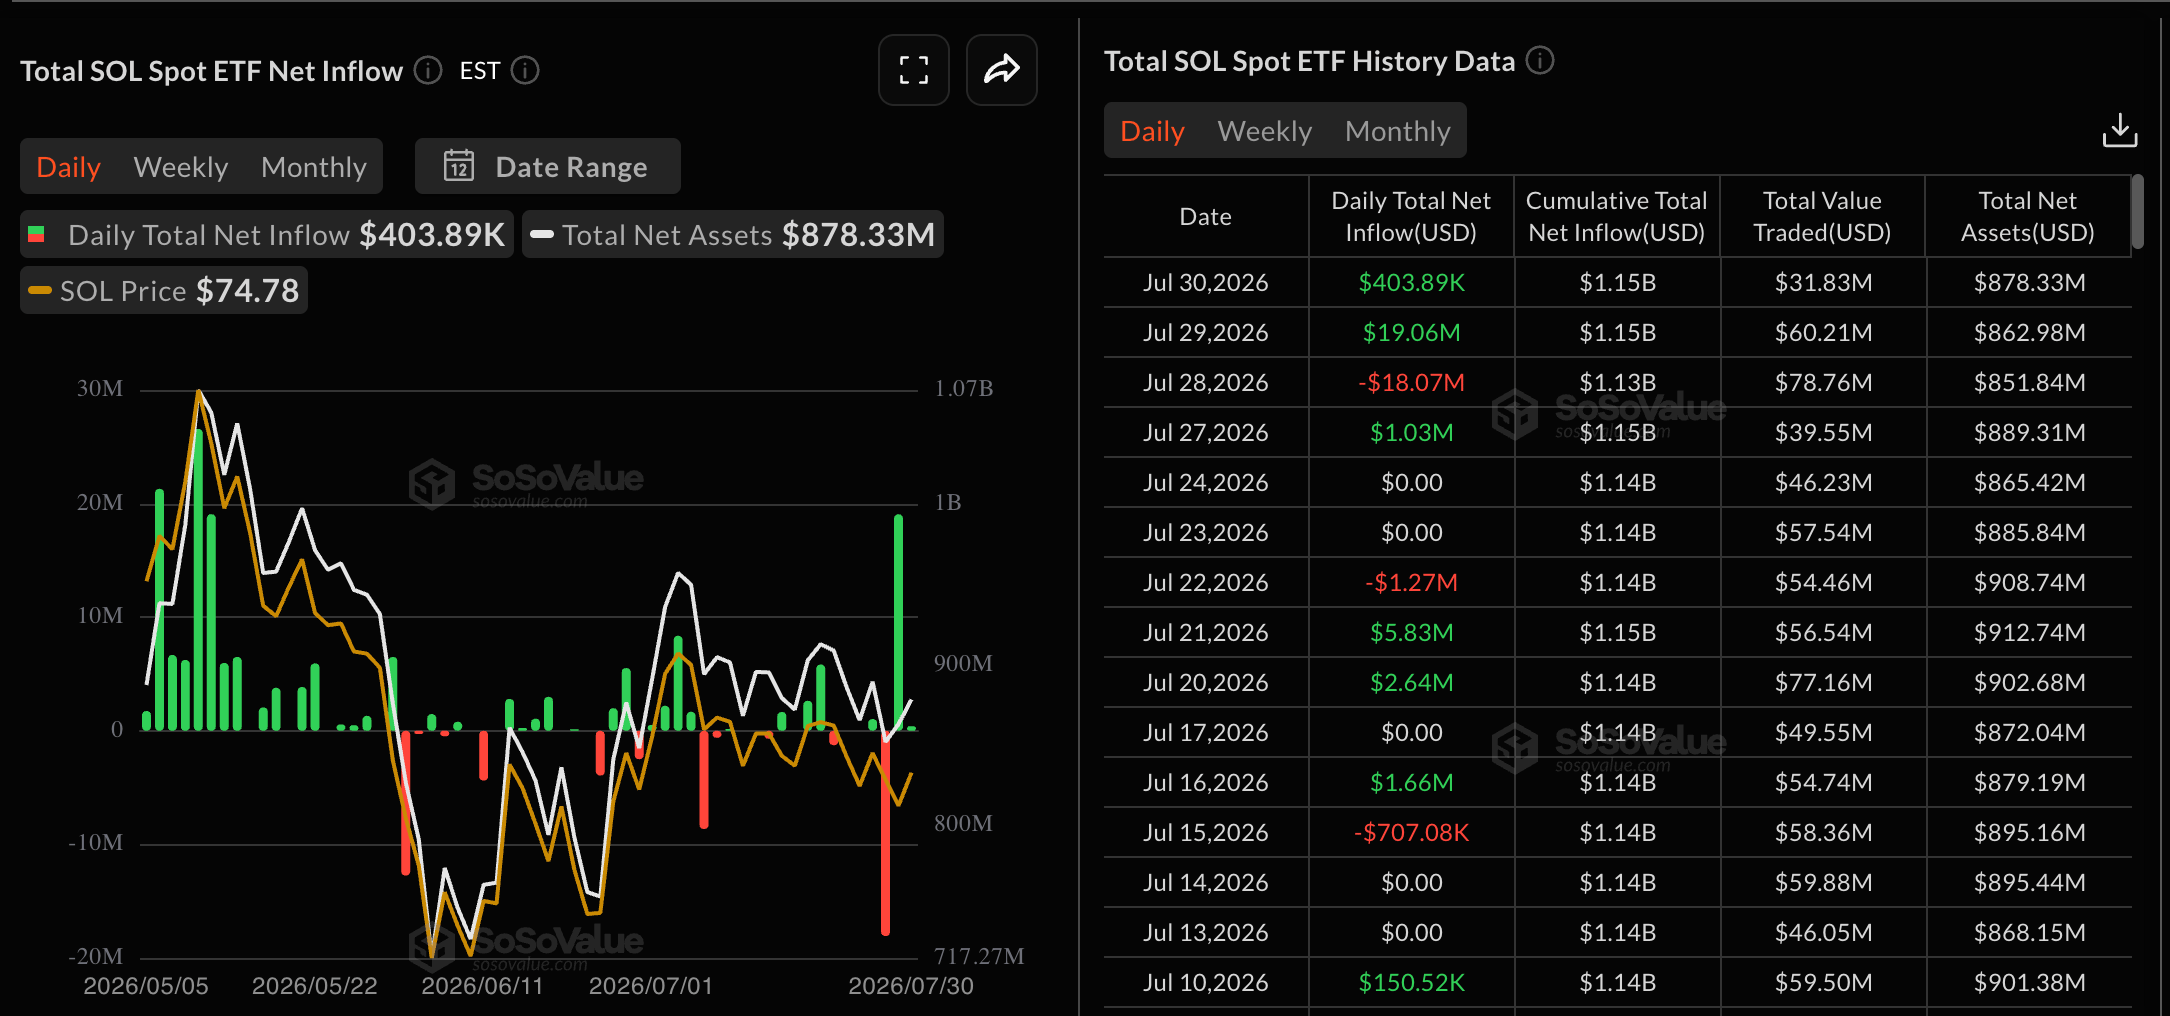
SOL ETFs data. Source: Sosovalue
SOL derivatives data. Source: CoinGlass

Technical outlook: Will Solana break above its 50-day EMA?

Solana keeps a mixed near-term bias as price approaches the apex of a symmetrical pattern on the daily chart. SOL price is supported by a rising trendline near $72.95, while the overhead trendline coincides with the 50-day Exponential Moving Average (EMA) at $76.07.

The Relative Strength Index (RSI) at 45 on the daily chart suggests only modest downside pressure, and the Moving Average Convergence Divergence (MACD) lingering below its signal line hints that rallies remain vulnerable.

On the topside, a sustained close above the overhead cluster near the 50-day EMA at around $76.09 could target the more distant barrier at the 200-day EMA at around $93.61.

Chart Analysis SOL/USDT (Binance)
SOL/USDT daily price chart.

Looking down, immediate support comes from the rising trendline around $72.95. A daily close below this area would expose additional weakness toward the February 6 low at $67.50.

(The technical analysis of this story was written with the help of an AI tool. Know more.)

Disclaimer: For information purposes only. Past performance is not indicative of future results.
placeholder
Markets in 2026: Will gold, Bitcoin, and the U.S. dollar make history again? — These are how leading institutions thinkAfter a turbulent 2025, what lies ahead for commodities, forex, and cryptocurrency markets in 2026?
Author  Insights
Dec 25, 2025
After a turbulent 2025, what lies ahead for commodities, forex, and cryptocurrency markets in 2026?
placeholder
My Top 5 Stock Market Predictions for 2026Five 2026 market predictions written in a native, news-style voice: AI’s winners and losers, broader sector leadership, dividend demand, valuation cooling as the Shiller CAPE sits at 39 (Dec. 31, 2025), and quantum-computing bursts—while keeping all original facts and numbers unchanged.
Author  Mitrade
Jan 06, Tue
Five 2026 market predictions written in a native, news-style voice: AI’s winners and losers, broader sector leadership, dividend demand, valuation cooling as the Shiller CAPE sits at 39 (Dec. 31, 2025), and quantum-computing bursts—while keeping all original facts and numbers unchanged.
placeholder
Gold Price Forecast: XAU/USD keeps looking for direction above $4,500Gold (XAU/USD) trades lower for the second consecutive day on Friday, but remains contained within previous ranges, with downside attempts limited above the $4,500 line for now.
Author  FXStreet
May 22, Fri
Gold (XAU/USD) trades lower for the second consecutive day on Friday, but remains contained within previous ranges, with downside attempts limited above the $4,500 line for now.
placeholder
Gold Price Forecast: Can Gold Hold $4,020 as Fed Rate Hike Expectations Rise? As of the Asian session on July 30, gold prices ( XAUUSD) surged and then retraced following the Federal Reserve meeting, once falling to $4,028.62 during the session. From a market persp
Author  TradingKey
Yesterday 08: 48
As of the Asian session on July 30, gold prices ( XAUUSD) surged and then retraced following the Federal Reserve meeting, once falling to $4,028.62 during the session. From a market persp
placeholder
WTI holds losses around $82.50 on renewed US-Iran diplomatic hopesWest Texas Intermediate (WTI) oil price remains in the negative territory for the second successive day, trading around $82.60 per barrel during the Asian hours on Friday. Crude oil prices have lost ground following renewed hopes for a diplomatic solution to the US-Iran conflict.
Author  FXStreet
8 hours ago
West Texas Intermediate (WTI) oil price remains in the negative territory for the second successive day, trading around $82.60 per barrel during the Asian hours on Friday. Crude oil prices have lost ground following renewed hopes for a diplomatic solution to the US-Iran conflict.
Related Instrument
goTop
quote