


BNB Price Forecast: Bearish trend extends on risk-off mood and weak derivatives signals
- BNB extends its losses, trading at $635 on Thursday, as fresh Middle East tensions weigh on broader market sentiment.
- Derivatives metrics back bearish sentiment with negative funding rates and rising short bets.
- The technical outlook suggests further correction as momentum indicators continue to strengthen on the bearish side.
BNB (BNB), formerly known as Binance Coin, extends its losses, trading below $635 at the time of writing on Thursday amid fresh tensions in the Middle East, which weigh on broader market sentiment. The negative outlook strengthens as weakening derivatives metrics and BNB’s momentum indicators continue to point to the bearish side.
Fresh Middle-East tension caps risk sentiment
The broader risk appetite dampened on Thursday as the news came in that Iran's Revolutionary Guards had targeted a US airbase after what they described as an early morning US attack near Bandar Abbas airport, reported Reuters.
The report noted that they warned that any repeat of what they called aggression would draw a "more decisive" response and said responsibility for the consequences lay with the "aggressor".
Furthermore, major US-Iran disagreements over Tehran's nuclear program and the Strait of Hormuz keep geopolitical risk premium in play, dampening hopes for a diplomatic solution to end a three-month-old Iran war. These developments dampened investors' risk appetite, with Bitcoin (BTC) falling below $73,000, and BNB sliding below $636 on Thursday.
Bearish sentiment from derivatives markets
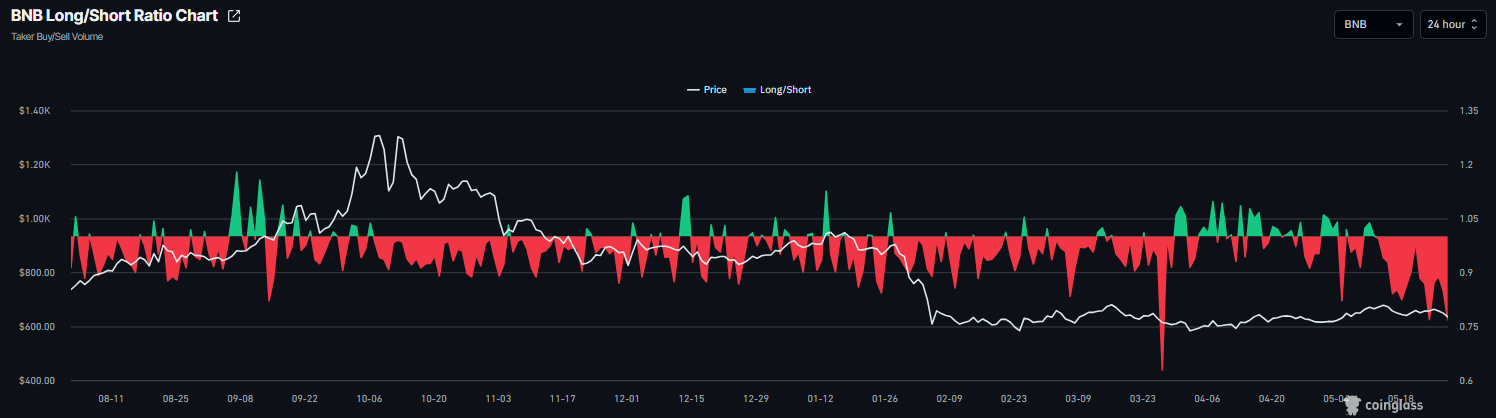
BNB’s derivatives data also supports a negative outlook. CoinGlass’ long-to-short ratio for BNB reads 0.76 on Thursday, nearing the lowest level over a month. The ratio being below one indicates bearish sentiment, as traders are betting that BNB's prices will fall.
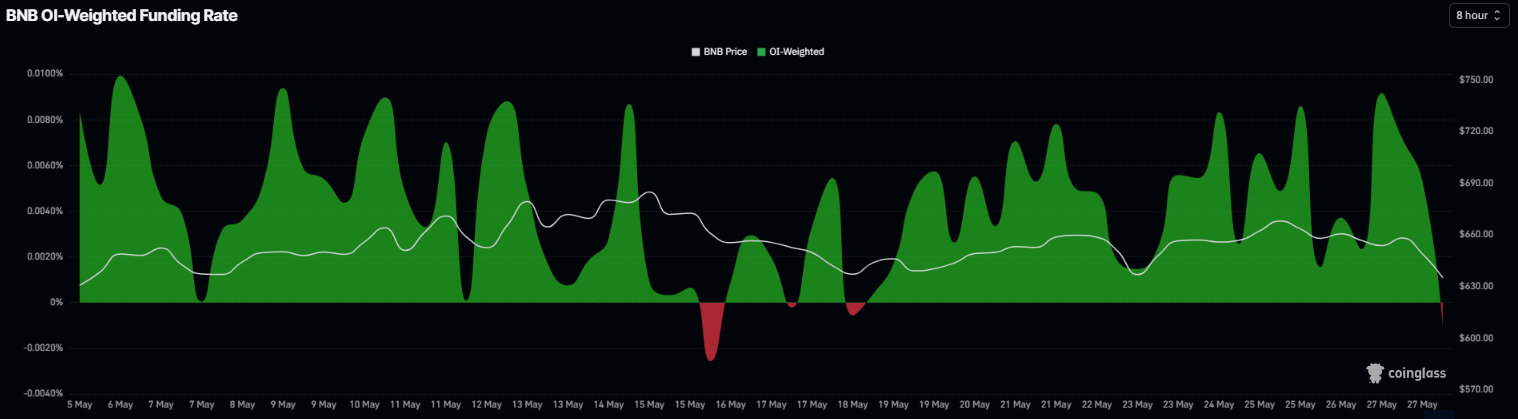
In addition, the funding rates flipped negative, reading -0.0010% on Thursday, indicating that shorts are paying longs and projecting bearish sentiment.
BNB Price Forecast: Slips below key EMAs
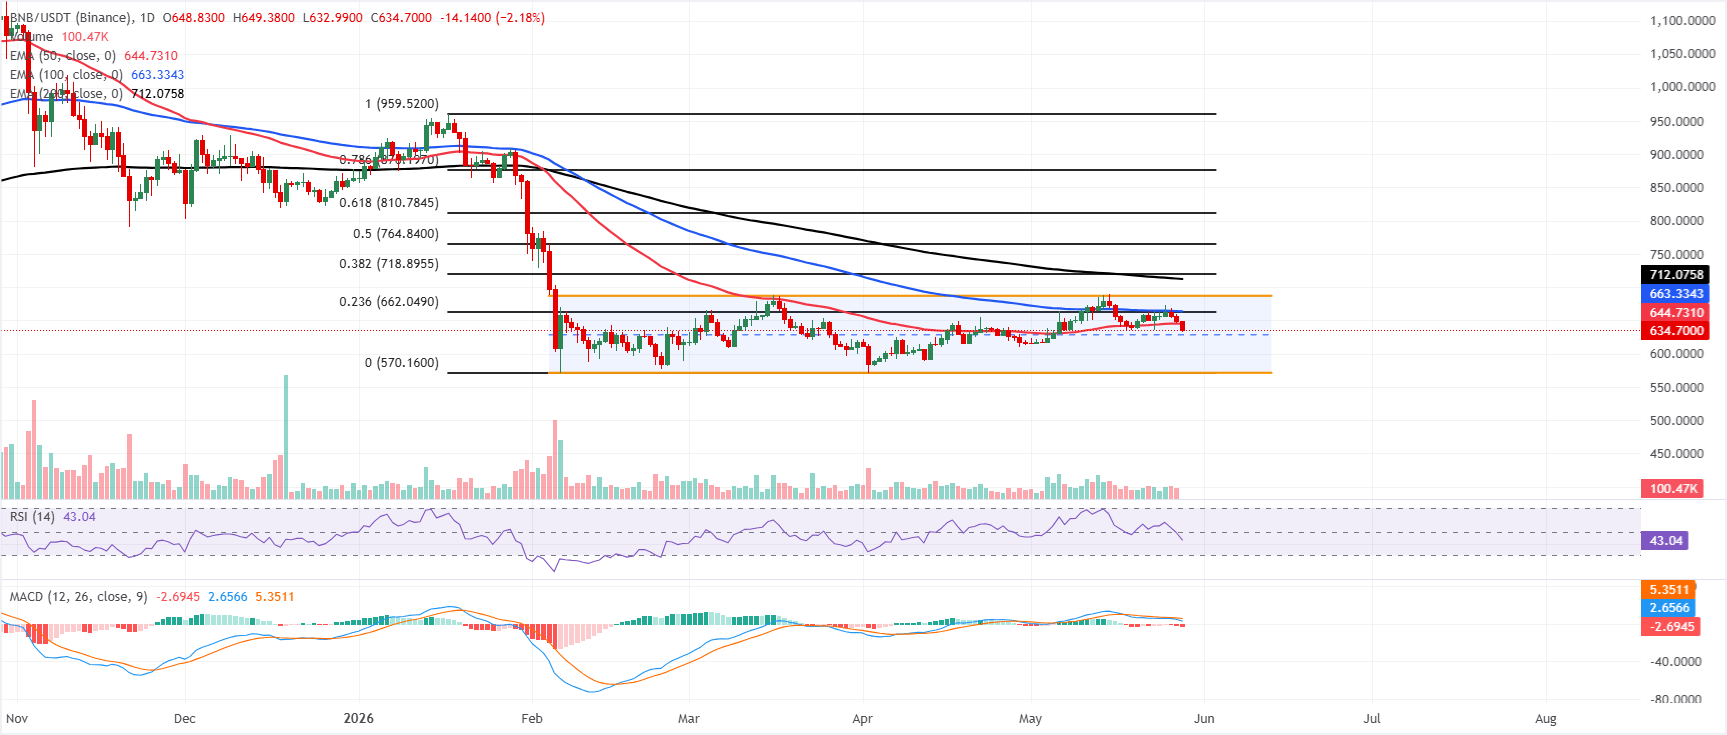
BNB price failed to close above the upper boundary of the horizontal channel in mid-May, declined by over 6% and slipped below the 50-day Exponential Moving Average (EMA) at $644.75 on Thursday. BNB maintains a capped tone as it holds below a dense band of EMAs and the 23.6% Fibonacci retracement at $662.05, all of which sit overhead, reinforcing the idea of supply on bounces within the broader parallel channel.
The Relative Strength Index (RSI) slips toward 43, and the Moving Average Convergence Divergence (MACD) remains in negative territory with the line below its signal, which together hint that bearish momentum is still in play even as the pair consolidates off recent lows.
On the topside, initial resistance emerges at the 50-day EMA around $644.75, followed by a tight cluster formed by the 23.6% Fibonacci retracement at $662.05 and the 100-day EMA at $663.34; a break above these would expose the channel top near $687.30 and the 38.2% retracement around $718.90.
On the downside, the lower boundary of the descending channel at $570.75 aligns with the Fibonacci anchor near $570.16 as the next meaningful support zone, where buyers may attempt to arrest a deeper pullback if the current consolidation gives way.
(The technical analysis of this story was written with the help of an AI tool.)
Recommended Articles


