

XRP Price Completes Wave 3 Move, Why $3.13 Must Be Broken

Source Newsbtc

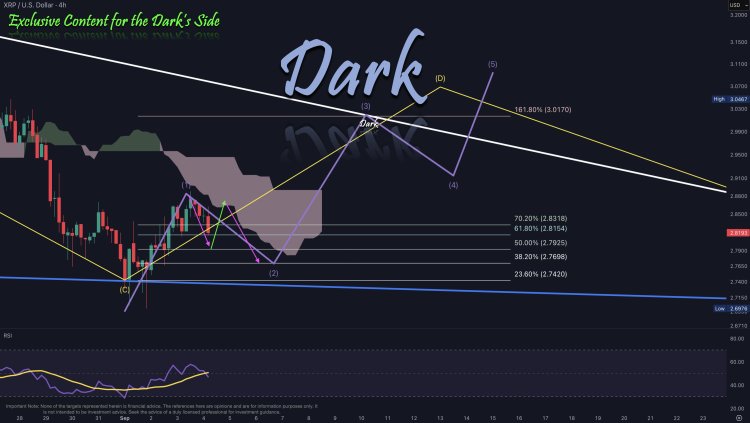
With the recent market recovery, the XRP price has been able to confirm an important Wave 3 move that was earlier highlighted by crypto analyst Dark Defender. Since this move has been completed, it is now time for the cryptocurrency to move into the next stage of the analysis. At this junction, there is a simple roadblock to a continuation of the rally and that lies at $3.13. In the follow-up analysis, Dark Defender reveals what could happen if the XRP price were to either break or get rejected at this level.

What To Expect From The XRP Price

In the analysis, Dark Defender highlighted that there is a possibility of some downside after the XRP price hits the 3rd Wave target. This 3rd Wave target sits between $3.01 and $3.07, and the initial run-up on Tuesday had seen the cryptocurrency quickly clear this level.

The next wave that could trigger the expected downtrend is Wave 4, which is historically bearish. This is not out of the ordinary, as a bullish wave, such as the 3rd Wave, will usually see a correction. This correction can often present an opportunity for bulls to reload while the Wave 4 plays out.

However, there is another important wave in this mix, and that is the E Wave. As the crypto analyst explains, for this wave to play out, it would be entirely dependent on where the price goes. From here, the next major level is $3.13, and that is the make-or-break level.
XRP Price

Now, if the bulls are able to completely break the resistance at $3.13 and continue further, then it would invalidate any bearish wave. But in the case of a full rejection and the price bouncing back, then the E wave could be triggered for the XRP price.

In the event of an E Wave trend, the XRP price would be expected to see a steep decline. This would go through all of the important Fibonacci levels, and the crypto analyst explains that it could send the XRP price tumbling back down to as low as $2.74.

Nevertheless, for now, the D wave remains in play, suggesting stronger dominance from the bulls. Once the Wave 4 is completed, then the last and final wave, the Wave 5, is expected to play out. This is historically the most bullish wave and could be responsible for a break above $3.13.

XRP price chart from TradingView.com
Disclaimer: For information purposes only. Past performance is not indicative of future results.
placeholder
Markets in 2026: Will gold, Bitcoin, and the U.S. dollar make history again? — These are how leading institutions thinkAfter a turbulent 2025, what lies ahead for commodities, forex, and cryptocurrency markets in 2026?
Author  Insights
Dec 25, 2025
After a turbulent 2025, what lies ahead for commodities, forex, and cryptocurrency markets in 2026?
placeholder
ECB Policy Outlook for 2026: What It Could Mean for the Euro’s Next MoveWith the ECB likely holding rates steady at 2.15% and the Fed potentially extending cuts into 2026, EUR/USD may test 1.20 if Eurozone growth proves resilient, but weaker growth and an ECB pivot could pull the pair back toward 1.13 and potentially 1.10.
Author  Mitrade
Dec 26, 2025
With the ECB likely holding rates steady at 2.15% and the Fed potentially extending cuts into 2026, EUR/USD may test 1.20 if Eurozone growth proves resilient, but weaker growth and an ECB pivot could pull the pair back toward 1.13 and potentially 1.10.
placeholder
My Top 5 Stock Market Predictions for 2026Five 2026 market predictions written in a native, news-style voice: AI’s winners and losers, broader sector leadership, dividend demand, valuation cooling as the Shiller CAPE sits at 39 (Dec. 31, 2025), and quantum-computing bursts—while keeping all original facts and numbers unchanged.
Author  Mitrade
Jan 06, Tue
Five 2026 market predictions written in a native, news-style voice: AI’s winners and losers, broader sector leadership, dividend demand, valuation cooling as the Shiller CAPE sits at 39 (Dec. 31, 2025), and quantum-computing bursts—while keeping all original facts and numbers unchanged.
placeholder
WTI climbs above $87.00 as Middle East conflict threatens key choke pointsWest Texas Intermediate (WTI) oil price extends gains for the fifth consecutive day, trading around $87.30 per barrel during the Asian hours on Thursday. Crude oil prices surged as escalating Middle East tensions stoked fears of widespread supply disruptions.
Author  FXStreet
Jul 23, Thu
West Texas Intermediate (WTI) oil price extends gains for the fifth consecutive day, trading around $87.30 per barrel during the Asian hours on Thursday. Crude oil prices surged as escalating Middle East tensions stoked fears of widespread supply disruptions.
placeholder
Gold Price Forecast: Oil Price Breaking $100 Fuels Inflation Concerns, Will Gold Prices Fall Further?As of the Asian session on July 24, gold prices ( XAUUSD) fell continuously during intraday trading, briefly approaching the $4,000 mark. Looking at the chart, gold prices rebounded this
Author  TradingKey
21 hours ago
As of the Asian session on July 24, gold prices ( XAUUSD) fell continuously during intraday trading, briefly approaching the $4,000 mark. Looking at the chart, gold prices rebounded this
goTop
quote