


Bitcoin STH Realized Price Signals Fragile Support: Correction Risk Intensifies
Bitcoin is entering a critical phase after losing the crucial $115,000 support level, with selling pressure mounting across key timeframes. The bullish momentum that previously fueled upside moves has faded, and price action now signals growing market weakness. As investor sentiment shifts from cautious optimism to concern, fears of a deeper correction below $110,000 are gaining traction among analysts.
According to CryptoQuant analyst Axel Adler, Bitcoin has established a short-term resistance level at $112,000—a constructive sign that the market is attempting to stabilize. However, Adler warns that the $112K–$105K zone remains structurally fragile, acting as a buffer that separates current price levels from more aggressive downside risk. If sellers push BTC below $105K, it could trigger a cascade of long liquidations and shake out short-term holders.
With macroeconomic uncertainty and declining ETF flows weighing on sentiment, Bitcoin’s path forward depends on how it reacts within this range. A recovery above $112K would signal resilience, while a breakdown could open the door to a broader market correction.
Short-Term Holder Risk Grows As Bitcoin Fails To Reclaim Momentum
According to Adler, the current structure of the Bitcoin market shows growing vulnerability, particularly among short-term holders (STHs). Adler points out that the 1-week to 1-month STH Realized Price sits at $117,000, meaning this entire cohort is now underwater. These investors, who tend to react emotionally to short-term volatility, may be the first to panic-sell if any negative catalysts emerge—potentially triggering a cascade of sell-offs across the broader market.
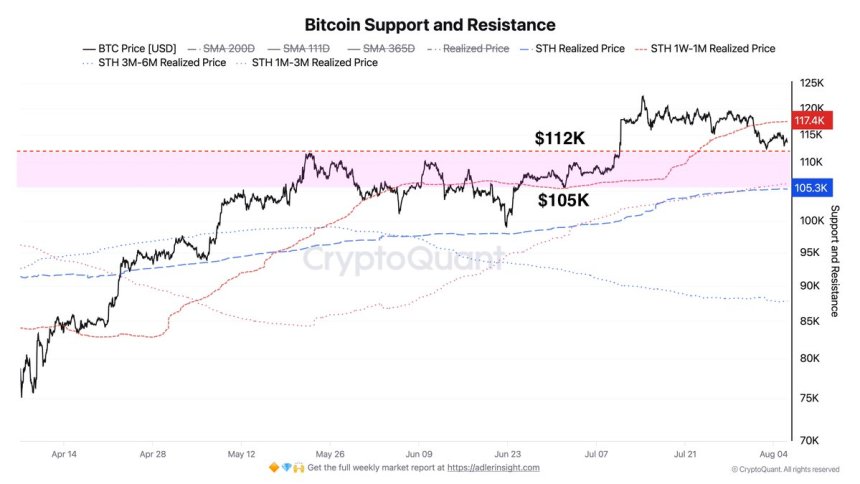
Adler further highlights the $105,000 level as a critical support zone, based on the aggregated STH Realized Price. If Bitcoin drops into this range, the pressure to hold will intensify, but it may also act as a strong technical and psychological level that could slow or even reverse the downtrend.
“The market remains weak,” Adler reaffirmed, maintaining his bearish stance from the day prior. He emphasized that retail investors are failing to push the price higher, and the lack of sustained demand adds to the growing structural weakness in the market.
Compounding the stress is recent weak US jobs data, which has sparked fresh speculation about potential interest rate cuts from the Federal Reserve. While this could be bullish for risk assets in the long run, the current uncertainty is adding pressure to already fragile market sentiment.
Bitcoin Attempts Recovery Amid Resistance Cluster
The 4-hour chart for Bitcoin (BTC) reveals a key battle playing out below the $116K resistance zone. After briefly dipping below $113K earlier this week, BTC has rebounded and is now trading around $115,478, approaching the 100 and 200 moving averages—currently acting as overhead resistance at $116,596 and $115,799, respectively.
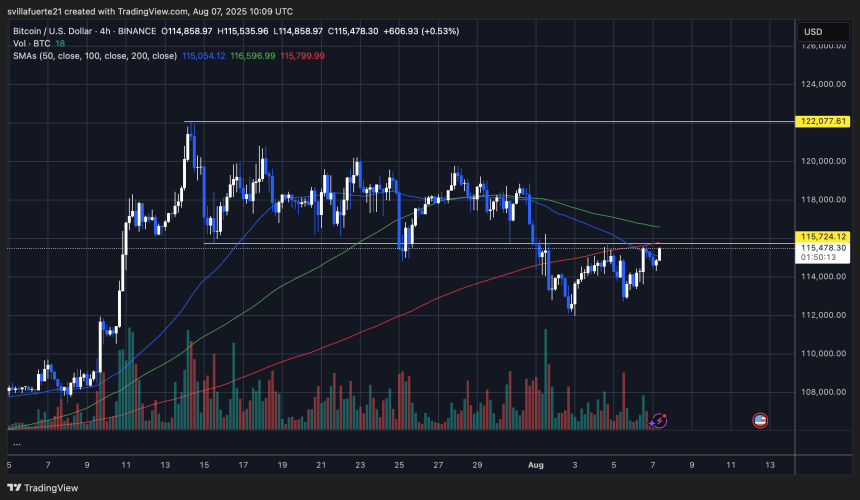
The price is also attempting to break back above the horizontal support-turned-resistance at $115,724, a level that held during July’s consolidation range. This cluster of resistance—formed by the SMAs and horizontal level—poses a significant short-term hurdle. A clean breakout above this zone with strong volume could signal renewed bullish momentum and open the path toward retesting the $122K range high.
However, volume remains relatively low compared to the July breakout, and the failed attempts to reclaim higher levels suggest buyers are cautious. Unless BTC can reclaim and consolidate above $116K, the rejection risk remains high, potentially pushing the price back into the lower $112K–$113K support band.
Featured image from Dall-E, chart from TradingView
Recommended Articles


