


Bitcoin steadies at $82,000: The five forces crushing the Uptober rally
Crypto markets have remained under pressure so far in October, with Bitcoin (BTC) sliding below $80,000 earlier this week before recovering to around $82,000 on Friday, as macroeconomic headwinds and cooling demand weigh on the market.
The crowd’s “Uptober” rally narrative has failed to play out so far, as persistent selling pressure and widespread liquidations have instead reinforced the “Rektober” narrative – a term used to describe an October marked by sharp losses rather than the gains traditionally associated with “Uptober.”
Bitcoin has struggled to sustain upside momentum this month; a few clear forces are holding it back. Let’s break them down.
Crypto market flushes out leverage longs
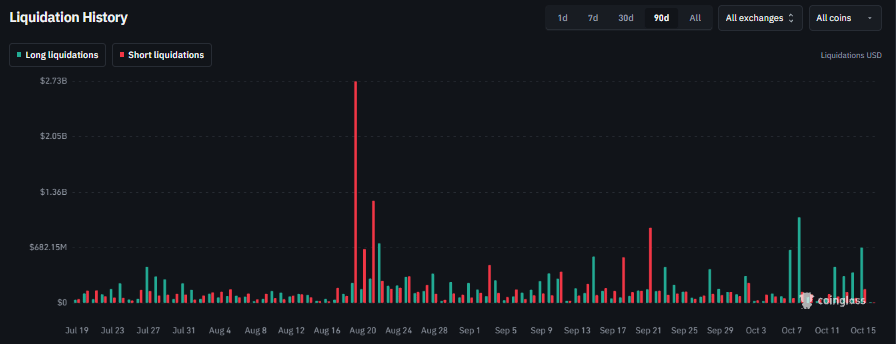
According to Coinglass data, liquidation activity continued this week, with leveraged long positions taking the biggest losses. Over $1.60 billion in long positions were liquidated during this period, highlighting the market’s overly bullish positioning.
Moreover, net total liquidations last week reached their highest level since mid-August, reflecting the scale of market-wide deleveraging and mounting pressure on bullish traders.
Elevated yields and stronger USD cap BTC
US Treasury yields remain the primary constraint for Bitcoin. The 10-year Treasury yield recently surged above 5.30%, approaching multi-decade highs. It has fallen slightly since then, but remain elevated above 5.07% as of Friday.
Elevated Treasury yields make government bonds more attractive to investors seeking relatively predictable returns compared with riskier assets such as BTC, which generates no yield. That higher safe return makes it harder for the Crypto King to attract new money.
Adding to this, the strengthening US Dollar (USD) compounds the pressure. The US Dollar Index (DXY) climbed to 102.94 on Wednesday, its highest level in about 18 months. A stronger Greenback can tighten global financial conditions, increase the cost of dollar-denominated risk assets, and reduce appetite for risk, making digital assets less appealing.
Inflation fears limit Crypto King
US inflation remains sticky and adds fuel to the ongoing fire. Hotter-than-expected Consumer Price Index (CPI) data released on Wednesday showed the annual rate at 3.7% in September, up from August’s 3.4% increase.
Moreover, core CPI, excluding volatile food and energy prices, increased by 2.6% YoY in the same month, up from August’s 2.4% rise. Meanwhile, headline and core CPI rose by 0.6% and 0.3% month over month, respectively.
Adding to this, the US Producer Price Index (PPI) advanced 1.3% in September, marking the largest gain since March 2022, and the yearly rate soared to 6.3%. Excluding volatile food and energy components, core PPI climbed 0.7% and 5% on a monthly and yearly basis, respectively, suggesting inflationary pressures are broadening beyond energy products.
These hotter figures point to persistent inflationary pressures, reaffirming market bets for further policy tightening by the US Federal Reserve (Fed).
Meanwhile, Fed Chairman Kevin Warsh joined International Monetary Fund (IMF) Managing Director Kristalina Georgieva for a fireside chat in Bangkok, Thailand, on Friday.
Warsh said that he does not "prejudge" interest-rate decisions, giving no preview of whether the central bank will hike or, as markets expect, hold short-term rates steady at its upcoming October 27-28 meeting.
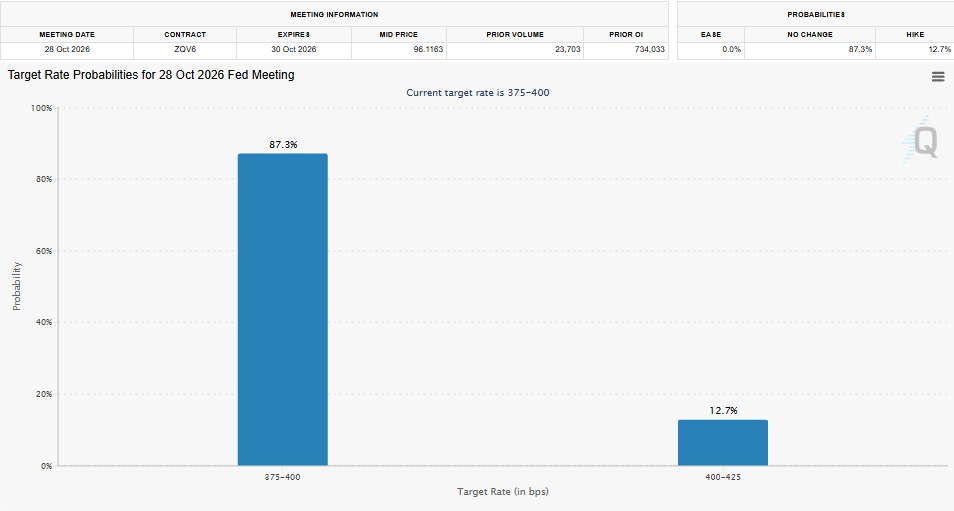
According to the CME FedWatch Tool, market expectations for an October rate hike eased after Warsh’s remarks, with the implied probability falling to around 12% on Friday.
Demand shows cooling signs
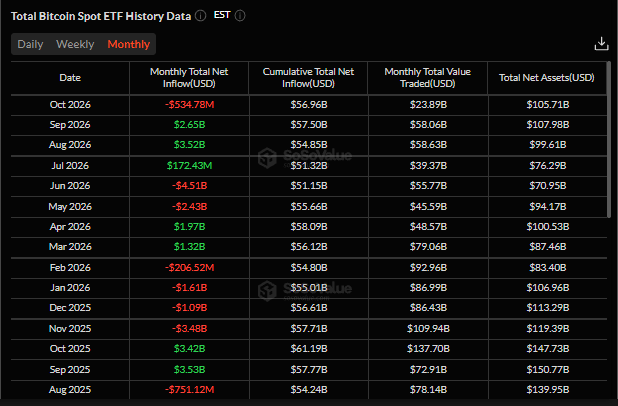
On the institutional front, spot demand is also clearly softening. US-listed spot Bitcoin Exchange Traded Funds (ETFs) have flipped to net outflows so far in October after recording strong inflows in September and August. This shift in investors’ sentiment has removed a key source of consistent buying pressure that previously cushioned and absorbed selling.
On the derivatives side, Chicago Mercantile Exchange (CME) Bitcoin futures positioning appears defensive. Moreover, last week’s Commitment of Traders (COT) report shows commercial traders remain net short and leveraged funds are more cautious, potentially limiting the fuel for a quick rally.
Key takeaway for traders
Overall, these factors – high Treasury yields, sticky inflation risks, a stronger USD, cooling ETF demand, and cautious futures positioning – have created a challenging backdrop for Bitcoin, repeatedly capping the Crypto King’s upside and its seasonal “Uptober” narrative.
However, none of this means BTC’s long-term story is broken. The weekly chart below shows BTC has made higher highs and lower lows after breaking a descending trendline in August, with price facing resistance and rejection near recent highs around $87,000. Momentum indicators have started to ease as the recent decline extends. However, holding above the $75,000-$76,500 support zone would keep the bullish structure in place.
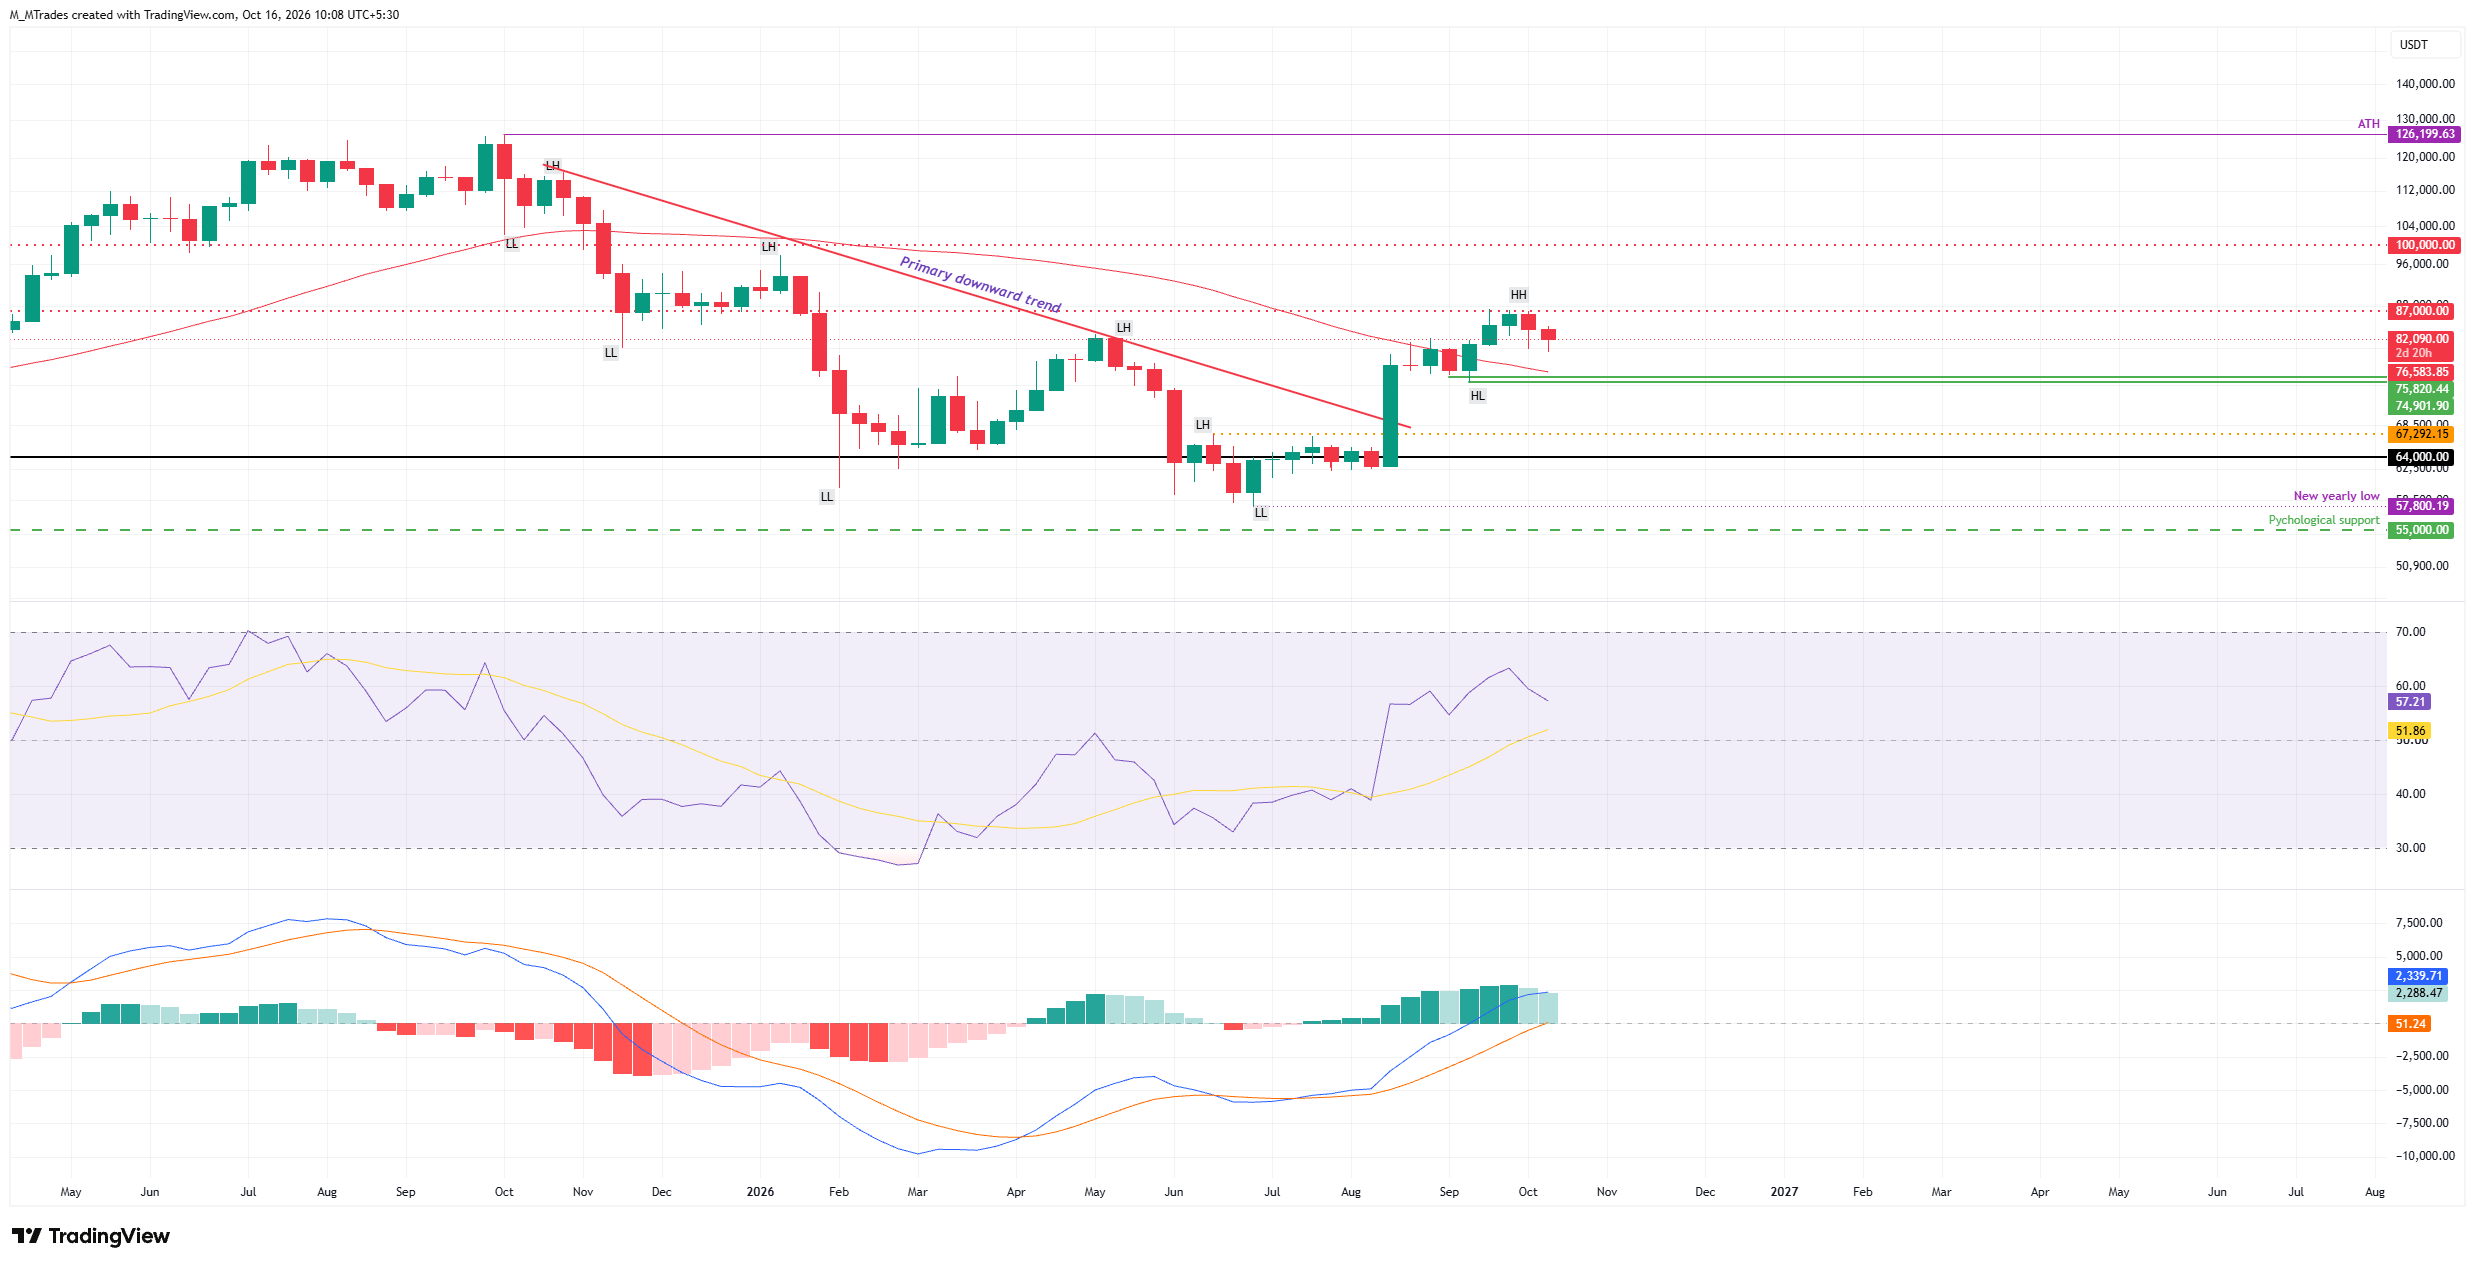
Looking ahead, ETF flow trends and the Fed’s upcoming interest rate decision on October 28 could provide fresh direction for BTC and the broader crypto market. Market participants will closely watch signals on the Fed’s policy outlook, as shifts in rate expectations are likely to influence risk appetite and demand for cryptocurrencies.
Bitcoin, altcoins, stablecoins FAQs
Bitcoin is the largest cryptocurrency by market capitalization, a virtual currency designed to serve as money. This form of payment cannot be controlled by any one person, group, or entity, which eliminates the need for third-party participation during financial transactions.
Altcoins are any cryptocurrency apart from Bitcoin, but some also regard Ethereum as a non-altcoin because it is from these two cryptocurrencies that forking happens. If this is true, then Litecoin is the first altcoin, forked from the Bitcoin protocol and, therefore, an “improved” version of it.
Stablecoins are cryptocurrencies designed to have a stable price, with their value backed by a reserve of the asset it represents. To achieve this, the value of any one stablecoin is pegged to a commodity or financial instrument, such as the US Dollar (USD), with its supply regulated by an algorithm or demand. The main goal of stablecoins is to provide an on/off-ramp for investors willing to trade and invest in cryptocurrencies. Stablecoins also allow investors to store value since cryptocurrencies, in general, are subject to volatility.
Bitcoin dominance is the ratio of Bitcoin's market capitalization to the total market capitalization of all cryptocurrencies combined. It provides a clear picture of Bitcoin’s interest among investors. A high BTC dominance typically happens before and during a bull run, in which investors resort to investing in relatively stable and high market capitalization cryptocurrency like Bitcoin. A drop in BTC dominance usually means that investors are moving their capital and/or profits to altcoins in a quest for higher returns, which usually triggers an explosion of altcoin rallies.
Recommended Articles


