


Gold Price Analysis Today | Forex Gold Analysis | XAU/USD Analysis - October 15, 2026


Today's Gold Price
Gold price chart for today
*0% Commission and Low Spreads 0️⃣
*$50,000 in Free Virtual Funds 💰
*$100 New Customer Bonus 🎁
Gold (XAU/USD) traded around $4,122 on the morning of October 15, 2026, after selling drove it below $4,100 to test $4,064–4,074. U.S. September CPI accelerated to 3.7%, with gasoline prices up 9.1% acting as a catalyst, lifting the market-implied probability of an October Fed rate increase to 47% and pushing the 10-year Treasury yield to 5.30%. The key question today is whether gold can break above resistance at $4,138–4,149 and establish a base.
Today's Key Points
| Key Points |
|
|
|
September CPI accelerates to 3.7%, above forecasts, prompting markets to raise October Fed rate-hike expectations to 47%
The U.S. Labor Department reported that CPI rose 0.6% month on month in September and accelerated to 3.7% year on year, above the 3.6% forecast. Core CPI was 2.6%. Gasoline prices surged 9.1%, accounting for more than half of the increase in inflation, alongside accelerating housing costs.
The hotter inflation data prompted markets to raise the probability of an October Fed rate increase to 47% from 21%, and to price in a total of 36 basis points of rate increases by year-end. The Beige Book also highlighted energy costs across four economic districts, prompting investors to sell gold to reduce high-interest-rate risk.
10-year Treasury yield reaches 5.30% as a stronger dollar pressures precious metals; gold falls below $4,100 before rebounding
Renewed expectations of rate increases pushed the U.S. 10-year Treasury yield to 5.30% and strengthened the dollar. Spot gold came under selling pressure, falling below $4,100 to a low of $4,064, down more than 1.47%. Silver fell 6.16% to $55.41 amid higher yields and a stronger dollar.
Analysts said the data gave hawks more room to argue their case and forced markets to reprice the prospect of policy easing. But when prices tested the $4,064–4,074 support zone, institutional buying began to absorb selling pressure, helping gold rebound to $4,122 and suggesting the market still has support at the main base.
Strait of Hormuz crisis intensifies as Brent rises above $106; a double-edged effect that supports safe havens but fuels inflation
Middle East tensions escalated after the Houthis attacked a Saudi Aramco building in Dhahran. Although the attack had no direct impact on production, attacks on commercial vessels around the Strait of Hormuz continued, lifting Brent crude to $106.06 amid unresolved risks to global oil-shipping routes.
Higher oil prices have a double-edged effect on gold. The unrest supports demand for safe-haven assets to hedge risk, but more expensive oil feeds directly into inflation, forcing the Fed to keep rates high for longer. Interest rates therefore constrain gold's ability to recover fully.



Technical Analysis of Gold (XAU/USD)
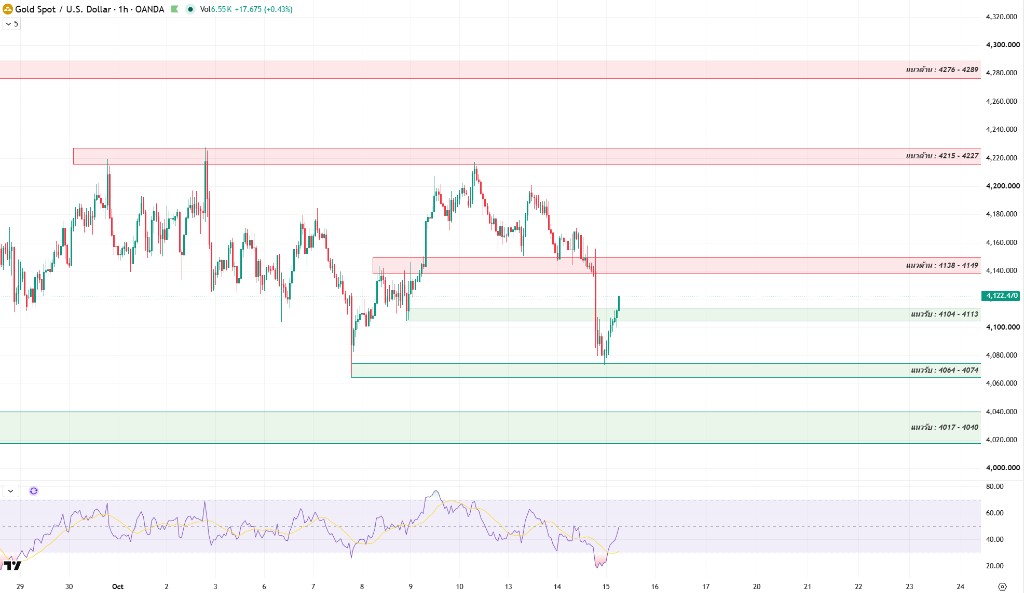
On the 1-hour chart, gold faced heavy selling from the $4,180–4,200 zone and printed a long lower wick while testing key support at $4,064–4,074 before buyers quickly pushed it back. Prices have since moved around $4,122 as they attempt to establish a new base and halt the current downside momentum.
The 1-hour RSI dropped deep into oversold territory below 25 before rebounding toward 45–50. This suggests that short-term selling pressure has eased and a technical rebound has emerged, although prices remain below the major moving averages.
The day's pivotal level is initial resistance at $4,138–4,149. If buyers can push the price to close above $4,149, it would reclaim the previous price base and open the way for higher highs and higher lows toward $4,215–4,227.
If prices can hold above support at $4,104–4,113 and break through resistance at $4,138–4,149, they could recover toward $4,215–4,227 and $4,276–4,289. But if they fail at initial resistance and fall below $4,104, they risk retesting the previous base at $4,064–4,074.
Today's Gold Price Outlook
| Scenarios |
|
|
|
Today's Trading Strategy
Short-term traders should approach range trading cautiously, watch the response at key support and resistance levels, and avoid chasing short positions while the RSI is just recovering from oversold conditions.
- Buy setup: Consider a pullback to support at $4,104–4,113 if buying support emerges, or follow a break above $4,149, with a target around $4,215–4,227 and a stop-loss below $4,095.
- Sell setup: Consider short positions if a rebound fails at resistance at $4,138–4,149 or $4,215–4,227, or on a break below $4,104, targeting $4,064–4,074. Place a stop-loss above resistance.
For long-term investors, while the broader picture still has structural support, interest-rate pressure remains high. Wait for a clear price base above key support before gradually accumulating positions.
Daily Support and Resistance Levels
| Type | Price Level |
| Support #1 | $4,104–4,113 |
| Support #2 | $4,064–4,074 |
| Support #3 | $4,017–4,040 |
| Resistance #1 | $4,138–4,149 |
| Resistance #2 | $4,215–4,227 |
| Resistance #3 | $4,276–4,289 |
Today's Questions (FAQ)
Why does sharply rising CPI become a short-term negative for gold prices?
Although gold is an inflation hedge, a stronger-than-expected CPI reading leads markets to place more weight on the possibility that the Fed will continue raising rates. This lifts Treasury yields and the dollar, increasing the opportunity cost of holding non-interest-bearing gold. Funds then flow out of gold and into the dollar instead.
Does Brent crude rising above $106 help or hurt gold more?
In the short term, it hurts more. War supports safe-haven demand, but more expensive oil feeds directly into inflation and compels the Fed to keep policy tight. Higher Treasury yields and a stronger dollar then outweigh the support from war, leaving gold under pressure until oil prices stabilize.
This English translation was prepared with the assistance of AI tools. Please refer to the original Thai article for the source content.
Read more
The above content was completed with the assistance of AI and has been reviewed by an editor.


