

Crude Oil trades stuck in tight range ahead of crucial OPEC+ meeting
- Oil prices stabilize on Monday as OPEC+ gathers online on Thursday to decide on extending production curbs.
- Iranian official Afshin Javan accuses OPEC+ of the current dire outlook for Oil prices and consumption in 2025.
- The US Dollar Index rallies as Trump threatens BRICS with tariffs and the Euro struggles due to France’s budget situation.
Crude Oil is still trading in a tight range on Monday, similar to levels seen last week, ahead of the most crucial OPEC+ meeting ahead of 2025 to be held on Thursday. Before the gathering, Iranian official Afshin Javan threw the cat among the pigeons by issuing an opinion piece pointing to OPEC+ as the culprit for the current low prices. The main takeaway of the opinion piece was that OPEC+ has kept oil prices elevated for too long, financing its competitors to boost cheaper alternatives.
The comments will likely be discussed and promise heated debates ahead of Thursday’s online meeting, in which OPEC+ is set to convene on the extension of its production curbs.
Meanwhile, the US Dollar Index (DXY) – which measures the performance of the US Dollar (USD) against a basket of currencies – is rolling through markets. The index gains ground after Trump said over the weekend that he would impose tariffs if BRICS countries tried to replace the USD with their own reserve currency.
The Euro (EUR), the main currency in the DXY basket, is struggling due to increasing odds of the French government falling as early as this week as Marine Le Pen threatened to support a no-confidence vote against the current prime minister unless the government accepts some of its demands about the budget. French Finance Minister Antoine Armand said Monday on Bloomberg television that France will not be held hostage, but markets have started to price in this political turmoil by punishing France’s sovereign debt.
At the time of writing, Crude Oil (WTI) trades at $68.41 and Brent Crude at $72.35.
Oil news and market movers: Iran calls out what everyone knows
- Afshin Javan, the No. 2 official in the Iranian delegation to OPEC+, published an opinion piece on November 26 that got picked up by Bloomberg on Monday. OPEC+ faces a supply glut largely of its own making following several years of production cuts. “This strategy in support of prices has effectively encouraged higher supply outside the group, particularly on the part of the US,” he said.
- Poland has shut down part of the Druzhba pipeline after detecting a leak, Bloomberg reported on Sunday, citing Polish media and the local firefighting service that responded to the leak report.
- OPEC+ is set to meet on Thursday online to discuss what to do with its production curbs for 2025.
Oil Technical Analysis: OPEC+ is seeing internal struggle
Crude Oil prices are stuck in a tight range as it appears that the OPEC+ theater is starting to fall apart. With the outlash from Iran, a heated discussion could be taking place on Thursday. Still, in terms of production curbs, OPEC+ can do little to tweak expectations, so the chances for more downturn in Oil prices are bigger than those for an upturn.
On the upside, the pivotal level at $71.46 and the 100-day Simple Moving Average (SMA) at $72.01 are the two main resistances. The 200-day SMA at $76.18 is still far off, although it could be tested if tensions intensify further. In its rally towards that 200-day SMA, the pivotal level at $75.27 could still slow down any upticks.
On the other side, traders need to look towards $67.12 – a level that held the price in May and June 2023 – to find the first support. In case that breaks, the 2024 year-to-date low emerges at $64.75, followed by $64.38, the low from 2023.
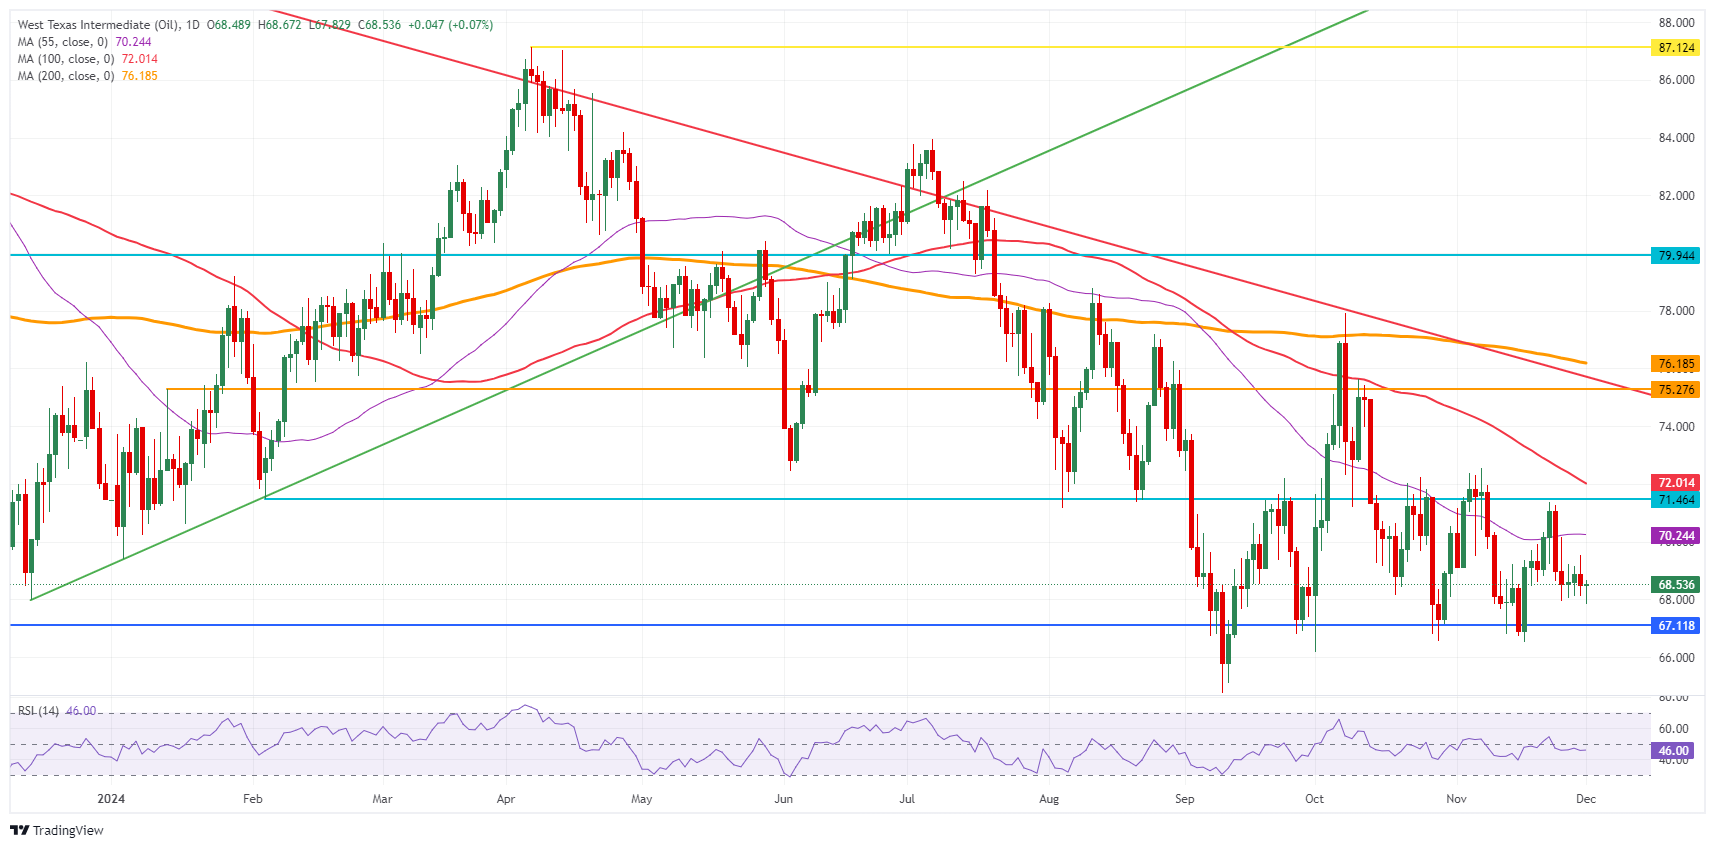
US WTI Crude Oil: Daily Chart
WTI Oil FAQs
WTI Oil is a type of Crude Oil sold on international markets. The WTI stands for West Texas Intermediate, one of three major types including Brent and Dubai Crude. WTI is also referred to as “light” and “sweet” because of its relatively low gravity and sulfur content respectively. It is considered a high quality Oil that is easily refined. It is sourced in the United States and distributed via the Cushing hub, which is considered “The Pipeline Crossroads of the World”. It is a benchmark for the Oil market and WTI price is frequently quoted in the media.
Like all assets, supply and demand are the key drivers of WTI Oil price. As such, global growth can be a driver of increased demand and vice versa for weak global growth. Political instability, wars, and sanctions can disrupt supply and impact prices. The decisions of OPEC, a group of major Oil-producing countries, is another key driver of price. The value of the US Dollar influences the price of WTI Crude Oil, since Oil is predominantly traded in US Dollars, thus a weaker US Dollar can make Oil more affordable and vice versa.
The weekly Oil inventory reports published by the American Petroleum Institute (API) and the Energy Information Agency (EIA) impact the price of WTI Oil. Changes in inventories reflect fluctuating supply and demand. If the data shows a drop in inventories it can indicate increased demand, pushing up Oil price. Higher inventories can reflect increased supply, pushing down prices. API’s report is published every Tuesday and EIA’s the day after. Their results are usually similar, falling within 1% of each other 75% of the time. The EIA data is considered more reliable, since it is a government agency.
OPEC (Organization of the Petroleum Exporting Countries) is a group of 12 Oil-producing nations who collectively decide production quotas for member countries at twice-yearly meetings. Their decisions often impact WTI Oil prices. When OPEC decides to lower quotas, it can tighten supply, pushing up Oil prices. When OPEC increases production, it has the opposite effect. OPEC+ refers to an expanded group that includes ten extra non-OPEC members, the most notable of which is Russia.
Recommended Articles


