


Gold slumbers in $2,580s ahead of US data, Fed decision
- Gold stabilizes at all-time highs as traders await US Retail Sales data and the key Fed policy decision on interest rates.
- Probabilities now favor a larger 0.50% cut to Fed base rates, which would boost the attractiveness of Gold.
- Analysts call a 10-year secular bull trend starting for commodities, including Gold.
Gold (XAU/USD) plateaus in the $2,580s on Tuesday, ahead of the release of potentially market-moving US data later in the day and the Federal Reserve (Fed) meeting on Wednesday.
Gold surges as bets increase the Fed will double cut
Gold shot to an all-time-high (ATH) of $2,589 on Monday after market bets that the Fed will make a double-dose 0.50% cut to interest rates at its meeting on Wednesday rose sharply, according to market-based gauges.
The expectation that the Fed will slash interest rates is positive for Gold because it lowers the opportunity cost of holding the yellow metal, which is a non-interest-paying asset, thus making it more attractive to investors.
US Retail Sales data, released at 12:30 GMT, could impact the Fed rates’ decision. If the data comes out above the 0.2% expected (0.3% ex autos) it will suggest the US economy is holding up better than expected and the Fed may not need to cut interest rates by such a large amount to help stimulate growth and employment. This scenario would be negative for Gold.
Alternatively, if Retail Sales undershoots expectations, it will further increase speculation of a half a percentage point cut coming on Wednesday, and positively impact Gold, which could rise to new highs.
Gold is entering a bullish super-cycle, analysts say
Longer-term prospects for the previous metal remain upbeat, according to several leading analysts, who are arguing there is evidence that commodities – including Gold – are entering a new bullish super-cycle.
“The last [two] times we saw these valuations for commodities was 1971 and 2000,” tweeted Michaël van de Poppe, Founder of MN Consultancy. “Commodities & #Crypto are extremely undervalued and it's likely that commodities go into a 10-year long bull market.”
Van de Poppe is not the only commentator saying commodities are entering a secular bull market. According to a recent “Flow Show” note from Bank of America Investment Strategist Jared Woodard, a “commodity secular bull market in the 2020s is just getting started as debt, deficits, demographics, reverse-globalization, AI & net-zero policies are all inflationary,” reported Kitco News.
Technical Analysis: Gold stalls in uptrend
Gold’s price has peaked and plateaued in the $2,580s. The trend is bullish in the short, medium, and long-term. Given that it is a principle of technical analysis that “the trend is your friend,” the odds favor more upside. If there is a correction, therefore, it is likely to be short-lived before Gold resumes its broader uptrend.
XAU/USD Daily Chart
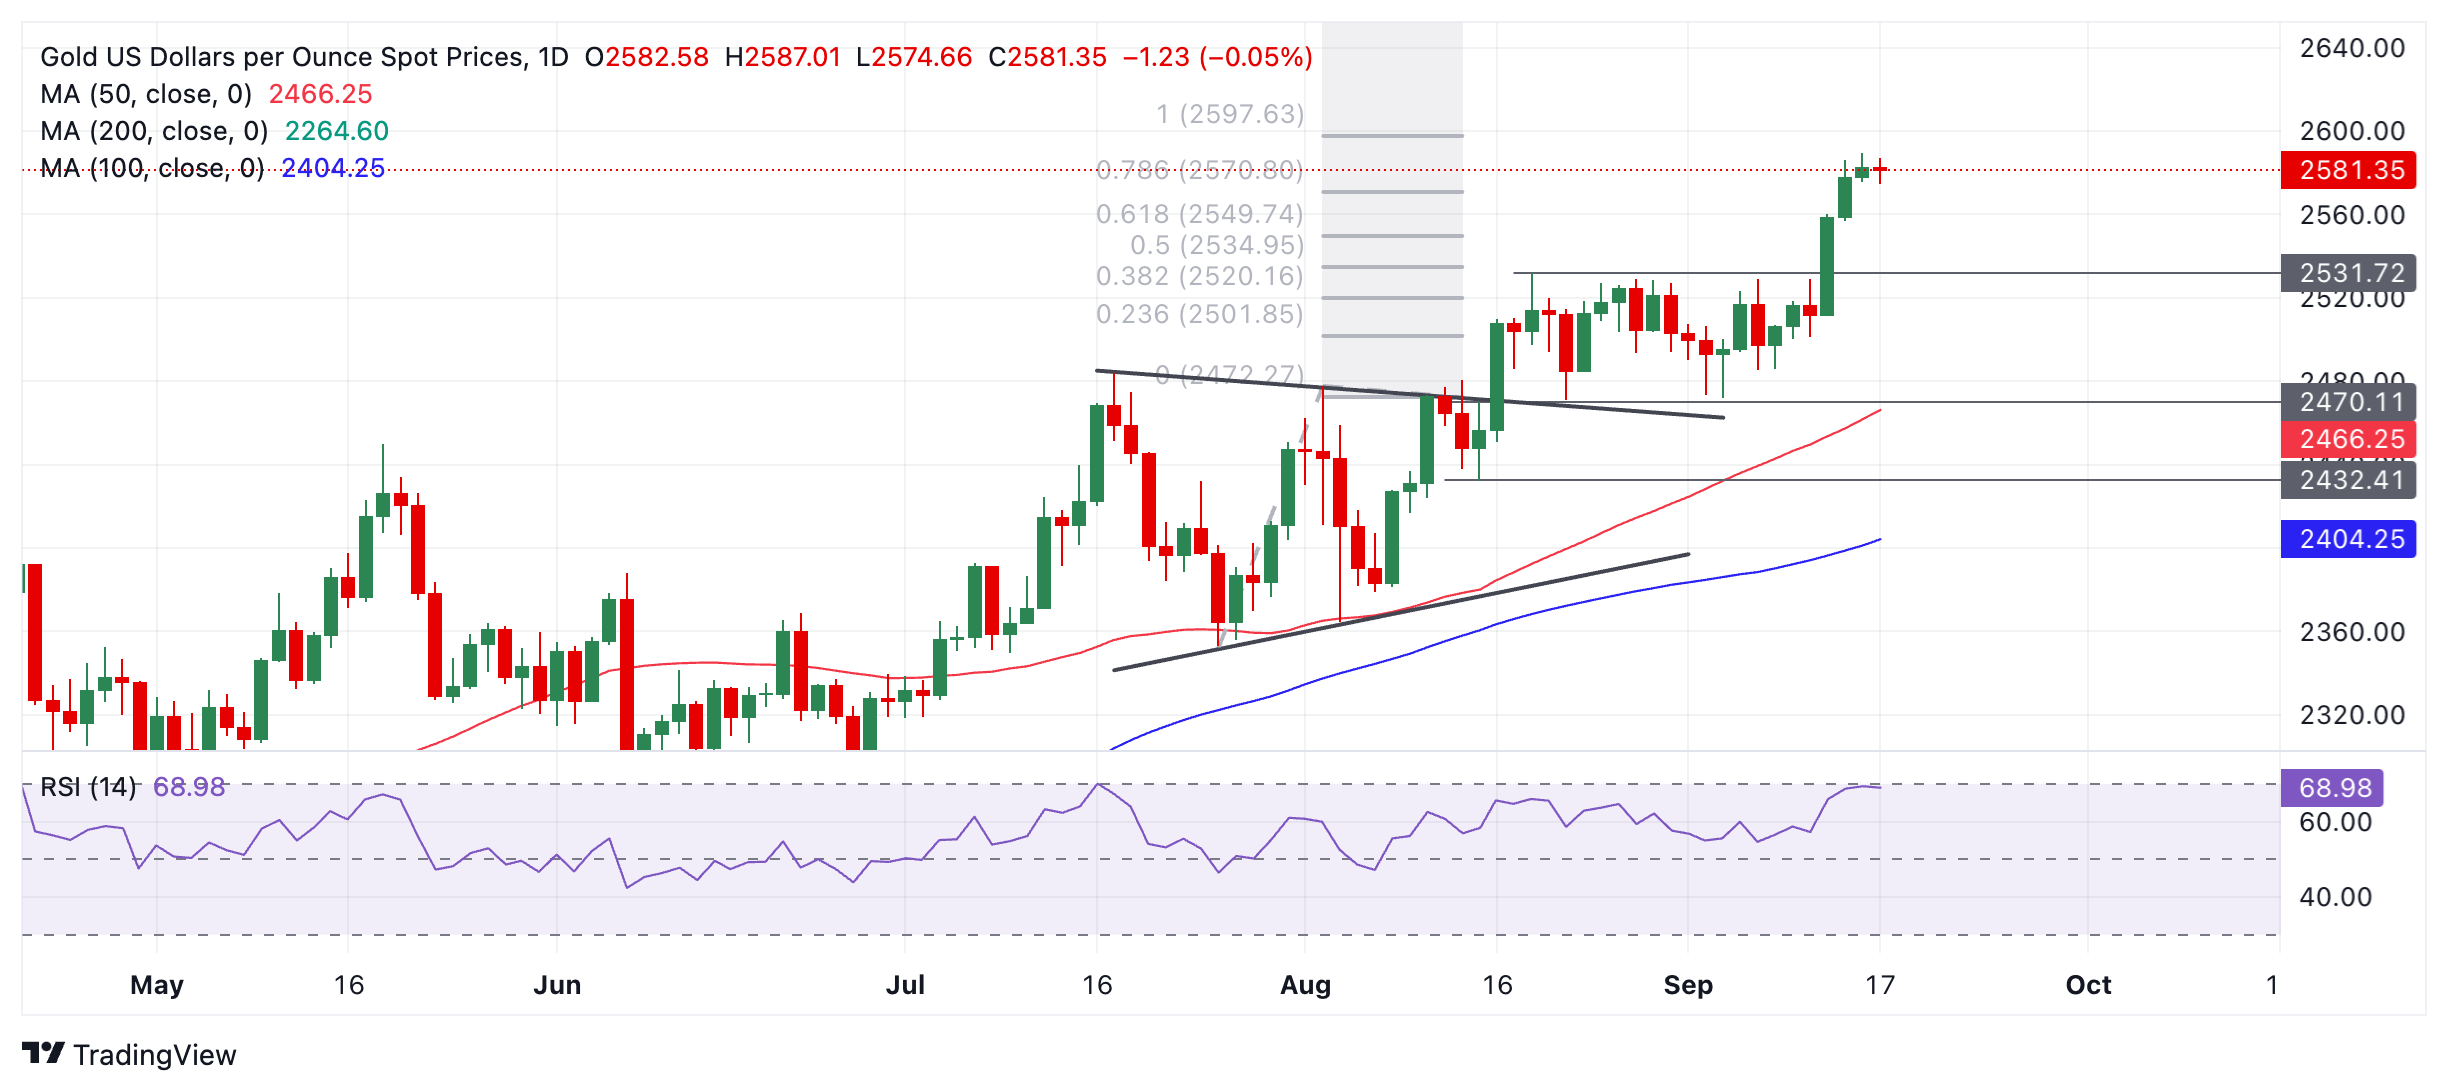
Gold is not yet overbought according to the Relative Strength Index (RSI), but it is close to overbought. If it enters the zone on a closing basis it will advise traders not to add to their long positions, although the rally may continue. If it enters overbought and then exits back into neutral it will be a sign of a deeper correction.
In the event of a correction, firm support lies at $2,550, $2,544 (0.382 Fibonacci retracement of the September rally), and $2,530 (former range high).
Economic Indicator
Retail Sales (MoM)
The Retail Sales data, released by the US Census Bureau on a monthly basis, measures the value in total receipts of retail and food stores in the United States. Monthly percent changes reflect the rate of changes in such sales. A stratified random sampling method is used to select approximately 4,800 retail and food services firms whose sales are then weighted and benchmarked to represent the complete universe of over three million retail and food services firms across the country. The data is adjusted for seasonal variations as well as holiday and trading-day differences, but not for price changes. Retail Sales data is widely followed as an indicator of consumer spending, which is a major driver of the US economy. Generally, a high reading is seen as bullish for the US Dollar (USD), while a low reading is seen as bearish.
Read more.Next release: Tue Sep 17, 2024 12:30
Frequency: Monthly
Consensus: 0.2%
Previous: 1%
Source: US Census Bureau
Retail Sales data published by the US Census Bureau is a leading indicator that gives important information about consumer spending, which has a significant impact on the GDP. Although strong sales figures are likely to boost the USD, external factors, such as weather conditions, could distort the data and paint a misleading picture. In addition to the headline data, changes in the Retail Sales Control Group could trigger a market reaction as it is used to prepare the estimates of Personal Consumption Expenditures for most goods.
Recommended Articles


