


Brent Crude Oil Price Forecast: Trump Eases Sanctions on Russia, Oil Prices Under Pressure Below $110, Can They Still Rise?
TradingKey - On Monday (October 19), Brent (UKOIL) crude oil prices fell noticeably at the open today after a sharp rally last Friday. As of press time, oil prices were down about 2.1%, trading near $107.70. Previously, Brent crude touched $110 during intraday trading on Friday, hitting a new high since May, and eventually settled at $109.86 per barrel. However, as the U.S. announced the easing of certain sanctions and tariff restrictions on Russia, market expectations for increased Russian energy exports mounted, pushing oil prices lower at the open this week.
US Eases Russian Sanctions, Weighing on Oil Prices Amid Expectations of Increased Supply
From a fundamental perspective, the recent drop in Brent crude was primarily driven by changes in Russia's energy export policies.
U.S. President Donald Trump signed an executive order last Friday waiving certain sanctions and tariff measures against Russia. Under the arrangement, Russia may increase diesel exports to the U.S. and other markets, initially planning to export about 2.3 million barrels in October and subsequently increasing that to 7.6 million barrels per month. This policy shift raised market expectations of increased Russian refined product supply, easing some of the energy supply tightness concerns previously caused by Middle East shipping disruptions.
However, U.S. Secretary of State Marco Rubio stated that the administration will take up to 60 days to evaluate the impact of the sanctions and tariff policies on the global economy. Therefore, whether Russian energy exports can continue to increase, as well as the actual size of any increase, remains uncertain for now.
Notably, crude oil supply risks in the Middle East continue to provide support for oil prices.
Last week, Saudi energy facilities faced renewed attack risks, while attacks on commercial vessels near the Strait of Hormuz increased. According to data from energy analytics firm Kpler, hit by the deteriorating shipping security situation, the seven-day average of Persian Gulf crude shipments fell to around 8.5 million barrels per day last week, down from over 20 million barrels per day the prior week. At least 10 attacks involving commercial vessels were reported during the same period.
Although major oil producers such as Saudi Arabia had previously gradually restored some exports, shipping restrictions, rising insurance costs, and transport route adjustments continue to affect actual crude deliveries.
Brent Crude Oil Price Technical Analysis
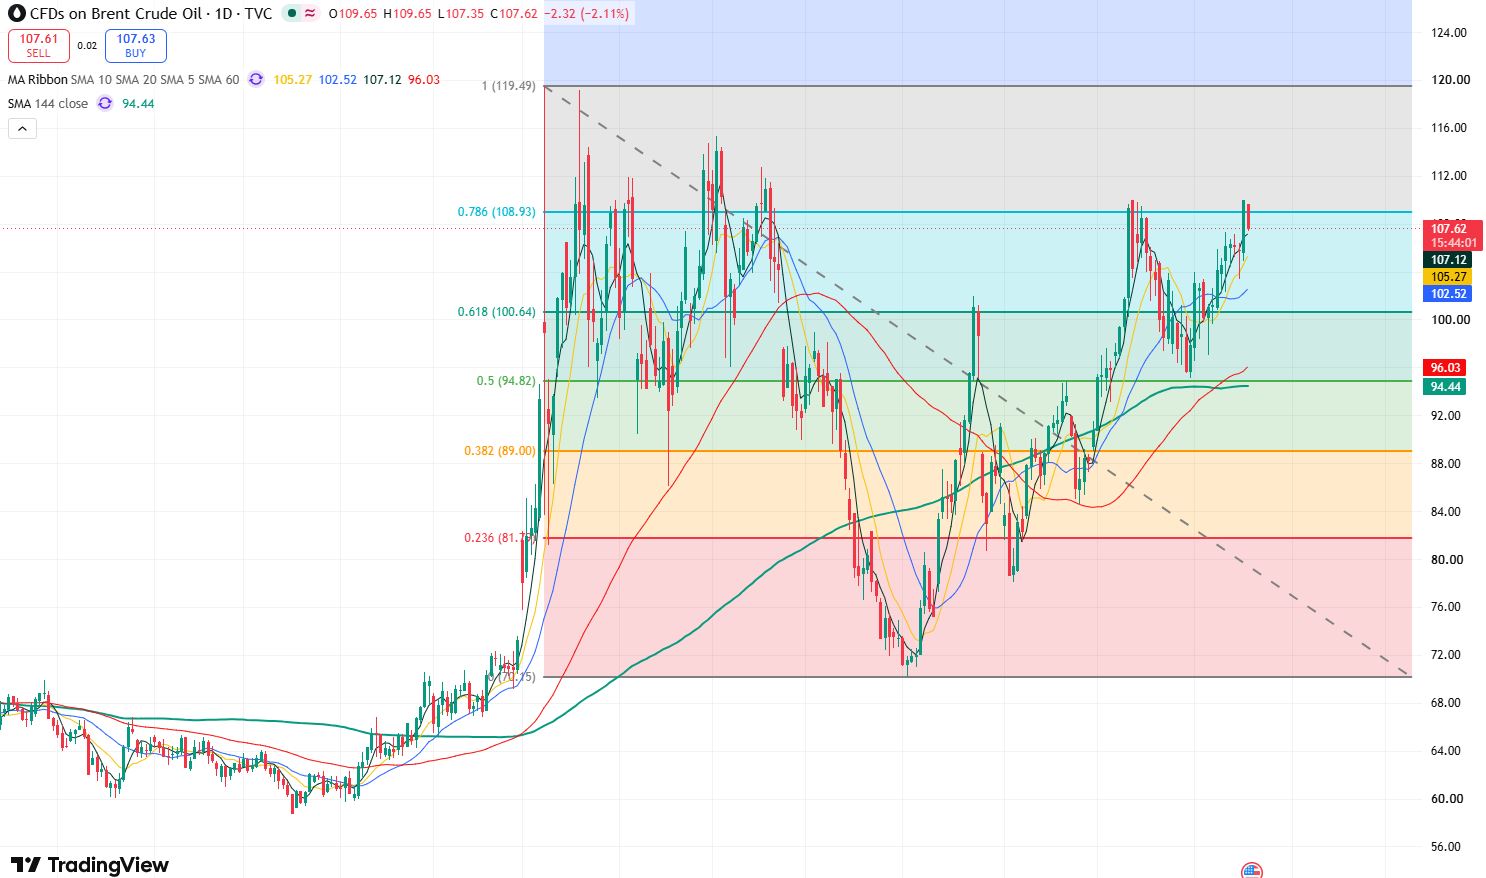
Brent crude oil daily price chart, Source: TradingView
From the daily chart, oil prices have recently tested the $110 mark twice to the upside but failed to break through on both occasions, indicating clear profit-taking pressure at this level. In the short term, oil prices may pull back downward.
In terms of technical indicators, the Relative Strength Index (RSI) sits near 59.6, remaining in neutral-to-bullish territory, while the MACD maintains a bullish signal.Technical indicators show that despite the short-term price pullback, the previously formed upward momentum has not fully dissipated.
On the downside, focus first on $107. If oil prices can stabilize around $107, there remains a short-term possibility of retesting the $110 mark to the upside. If prices fall further below $107, the next support level to watch is the $105–$106 zone, with $105 near the 60-day moving average. If oil prices break below the 60-day moving average, they may fall further to around $103.
On the upside, the key resistance level for oil prices to watch is $110. If this level can be decisively broken and held, oil prices will open up upside room toward $115–$120.
Recommended Articles


