


Gold Price Forecast: Why Did Gold Rebound After September PPI Rose by Most in Nearly Four Years?


TradingKey - As of the European session on October 16, gold prices (XAUUSD) extended their rebound, with the latest price trading near $4,185, up about 0.4% on the day. Gold prices had previously dropped to near $4,073 before staging a continuous recovery. Yesterday, US PPI and retail sales data both came in higher than market expectations, but the US dollar and Treasury yields did not push higher and instead pulled back, providing support for gold.
September PPI and Retail Sales Exceed Expectations, but Fed October Rate Hike Expectations Fail to Heat Up Further
Data released by the U.S. Bureau of Labor Statistics on Thursday showed that the September PPI rose 1.3% month-over-month, its largest increase since March 2022, and 6.3% year-over-year, the highest level since December 2022. Energy prices were the primary driver, with final demand energy prices rising 10.8% in September and gasoline prices surging 20.3%; final demand prices excluding food, energy, and trade services rose 0.5%, indicating that production-side price pressures have also expanded.
Meanwhile, U.S. retail sales rose 0.8% month-over-month in September, beating market expectations of 0.3%, with August's gain revised up to 1.3%. However, sales growth was largely due to higher gasoline prices, with gas station sales up 6.4% in a single month; core retail sales excluding automobiles, gasoline, building materials, and food services grew by just 0.1%, showing that actual consumer spending momentum is not as strong as headline figures suggest.
From the perspective of gold, the two sets of data are inherently bearish. A sharp rise in the PPI implies growing inflationary pressures on the production side, while resilient retail sales indicate that the U.S. economy remains relatively strong. Both factors theoretically reduce the Federal Reserve's room to rapidly ease monetary policy, but market reactions to the data did not entirely lean toward rate hikes.
According to the CME FedWatch Tool, the market probability of a Fed rate hike at its October 27–28 meeting was about 15%, noticeably lower than levels prior to the PPI release. One reason is the recent weak performance in the labor market, and the main driver of retail sales growth came from rising energy prices, while core consumption growth was relatively limited.
In addition, Federal Reserve Chair Kevin Warsh's latest speech on Friday gave no clear signal of an October rate hike, and market pricing for an October rate hike fell further to around 15% following his remarks. Meanwhile, the 10-year U.S. Treasury yield fell back below 5.1%, and the U.S. Dollar Index also weakened.
Therefore, despite the overall strong PPI and retail sales data, the market did not further significantly raise expectations for a short-term rate hike. Instead, the pullback in the U.S. dollar and U.S. Treasury yields became a key support for gold's rebound today.
Gold Price Technical Analysis
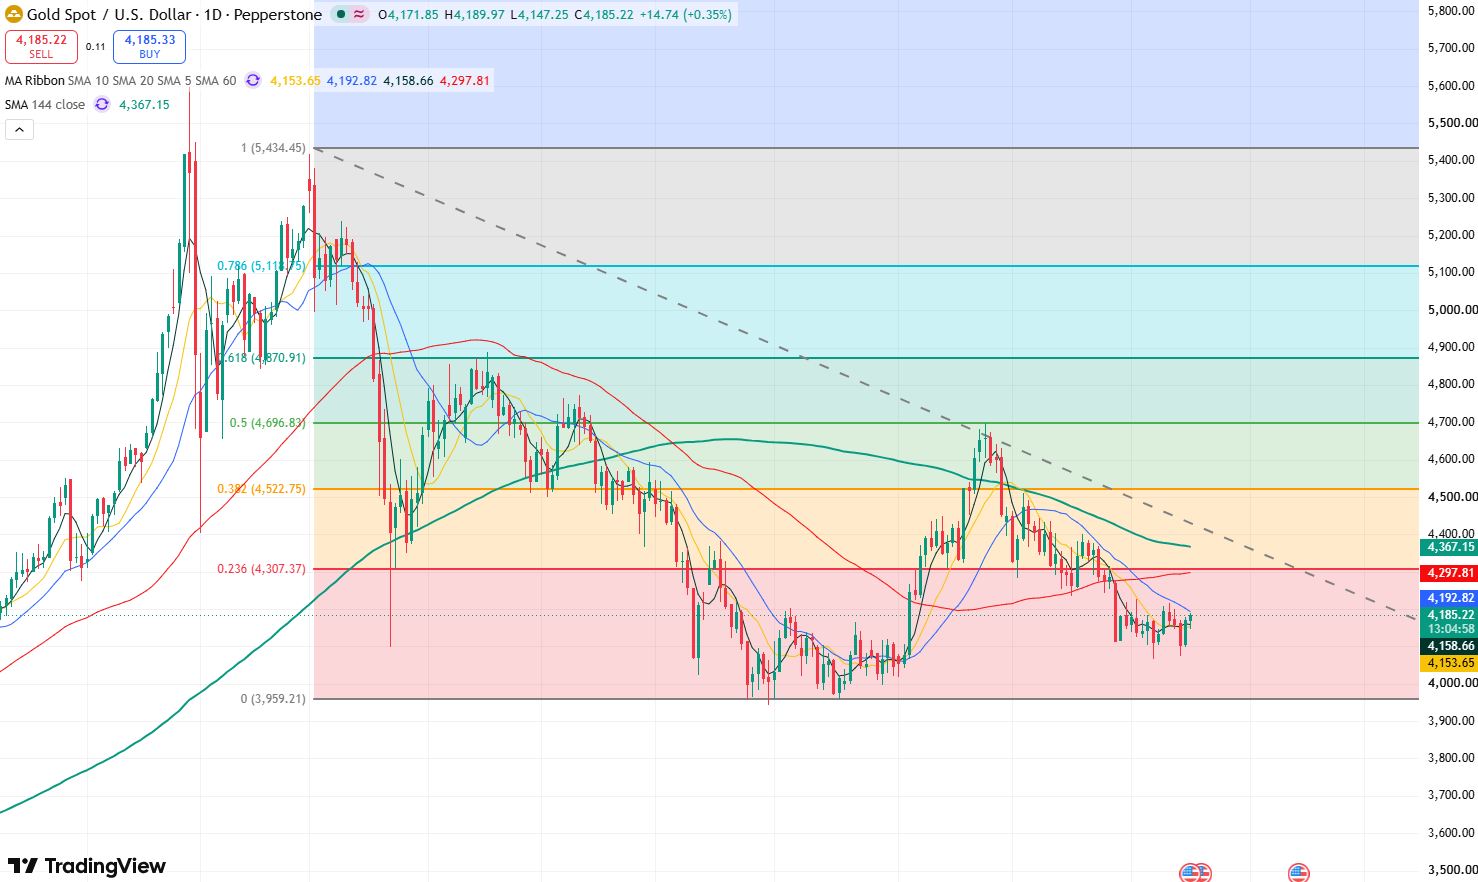
Gold price daily chart, Source: TradingView
Based on the gold daily chart, prices rebounded quickly after finding support near $4,073 and have now returned above $4,150, repairing the short-term bullish structure. Meanwhile, the candlestick chart formed a bullish engulfing pattern on Thursday, further bolstering market bullish momentum, suggesting gold prices may extend their rebound in the short term.
Currently, the $4,150 level acts as key short-term support. If gold prices can hold firmly above this position, the rebound is expected to continue testing $4,200 on the upside. If a valid breakout above $4,200 occurs, the next resistance will be around $4,230; upon a further break, the $4,300–$4,320 zone will become an important medium-term resistance.
On the downside, if prices fall back below $4,150, initial support lies near $4,130, with $4,100 to watch further down. Notably, if the recent low of $4,066 fails to hold, gold could retest the psychological $4,000 mark.
Read more
* The content presented above, whether from a third party or not, is considered as general advice only. This article should not be construed as containing investment advice, investment recommendations, an offer of or solicitation for any transactions in financial instruments.


