


Natural Gas trades near key support as Fed decision snaps June rally
- Natural Gas recovers slightly from Wednesday’s decline, which was prompted by the Federal Reserve decision.
- German utility company Uniper terminates Gas supply contracts with Russia’s Gazprom after a court ruling.
- The US Dollar Index trades sideways after a very volatile session on Wednesday.
Natural Gas price (XNG/USD) recovers slightly on Thursday close to the pivotal technical support at $3.08 after declining on Wednesday, when US Federal Reserve (Fed) Chairman Jerome Powell left the markets hung out to dry. With only one interest-rate cut projected in the dot plot for the remainder of the year and Powell unwilling to divert from the “data dependent” stance, markets did not see much reason to be enthusiastic about it all. This sour mood sent Natural Gas prices lower as traders priced in less demand over the summer horizon given the elevated rates in the US.
Meanwhile, the US Dollar Index (DXY), which tracks the Greenback’s value against six major currencies, traded very volatile on Wednesday. First, the US inflation report led to a substantial depreciation as it showed price pressures are cooling.. However, the weakness was largely pared back by the Fed meeting, which dampened hopes that this inflation report would be enough to get a firm commitment to an initial rate cut. The Fed has set up the Greenback to weaken further in summer, although this will largely depend on how economic data comes in.
Natural Gas is trading at $3.11 per MMBtu at the time of writing.
Natural Gas news and market movers: Headlines tell a whole other story
- Supply issues in Australia persist, with the Wheatstone offshore plant from Chevron still fully shut down. Repairs will take longer than expected, Reuters reports.
- A court ruling rewarded German company Uniper SE more than $14.1 billion in damages for undelivered Gas from Russia. This court ruling could result in a cut in supply for other European countries that are still very much dependent on Russian Gas flows, Bloomberg reports.
- US Venture Global LNG Inc. has signed a non-binding deal with a Ukrainian energy trading company to supply US Liquified Natural Gas (LNG) to the Ukrainian storages.
Natural Gas Technical Analysis: Hold for now
From a technical perspective, price action on Wednesday led to a firm test on support. With Fed Chairman Powell slamming the door on two quick rate cuts, Gas prices briefly crashed below the pivotal level at $3.08, but managed to close the day above it. The question now is how quickly markets will be able to shrug off this hawkish tilt from the Fed. Meanwhile, the increasing uncertainty over European Gas supplies should keep Gas prices supported.
The pivotal level near $3.07 (the high from March 6, 2023) remains key as prices on Wednesday closed above it by just a few cents. Looking up, the red descending trendline at $3.12 would likely slam down any attempts to jump higher. Further up, the fresh year-to-date high at $3.16 is the level to beat.
On the downside, the 200-day Simple Moving Average (SMA) acts as the first support near $2.53. Should that support area fail to hold, the next target could be the pivotal level near $2.14, with interim support by the 55-day SMA near $2.34. Further down, the biggest support comes at $2.11 with the 100-day SMA.
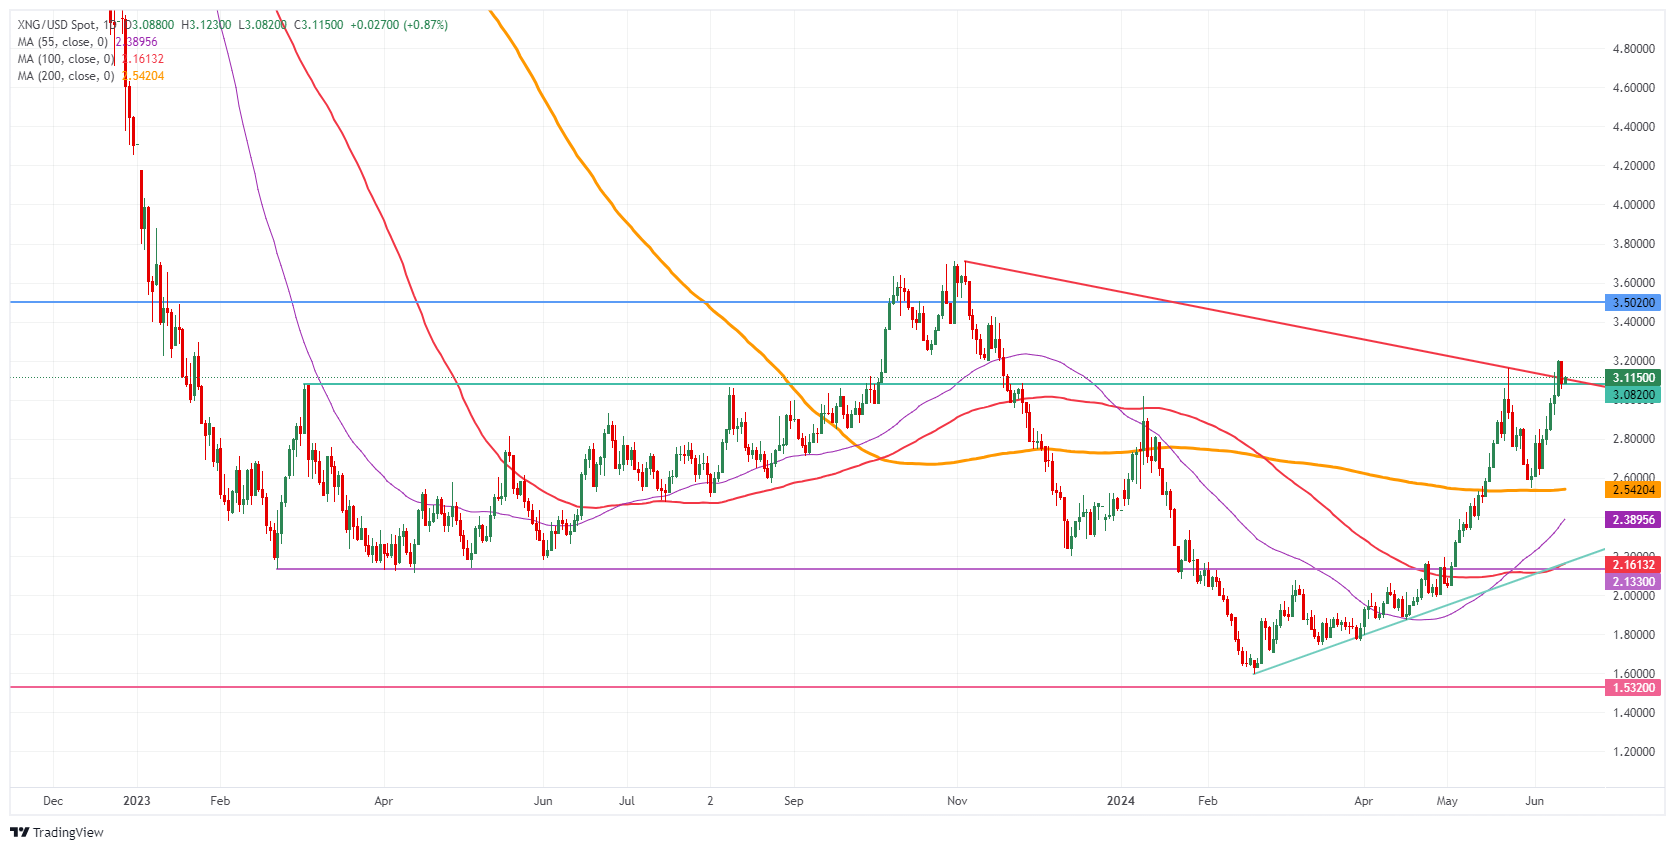
Natural Gas: Daily Chart
Natural Gas FAQs
Supply and demand dynamics are a key factor influencing Natural Gas prices, and are themselves influenced by global economic growth, industrial activity, population growth, production levels, and inventories. The weather impacts Natural Gas prices because more Gas is used during cold winters and hot summers for heating and cooling. Competition from other energy sources impacts prices as consumers may switch to cheaper sources. Geopolitical events are factors as exemplified by the war in Ukraine. Government policies relating to extraction, transportation, and environmental issues also impact prices.
The main economic release influencing Natural Gas prices is the weekly inventory bulletin from the Energy Information Administration (EIA), a US government agency that produces US gas market data. The EIA Gas bulletin usually comes out on Thursday at 14:30 GMT, a day after the EIA publishes its weekly Oil bulletin. Economic data from large consumers of Natural Gas can impact supply and demand, the largest of which include China, Germany and Japan. Natural Gas is primarily priced and traded in US Dollars, thus economic releases impacting the US Dollar are also factors.
The US Dollar is the world’s reserve currency and most commodities, including Natural Gas are priced and traded on international markets in US Dollars. As such, the value of the US Dollar is a factor in the price of Natural Gas, because if the Dollar strengthens it means less Dollars are required to buy the same volume of Gas (the price falls), and vice versa if USD strengthens.
Recommended Articles


