


Gold starts week on the back foot as US Dollar holds firm, Oil decline limits losses
- Gold starts the week on a bearish note as hawkish Federal Reserve expectations support the US Dollar.
- Traders await US PMI data and speeches from several Fed officials this week.
- XAU/USD holds a neutral outlook on the 4-hour chart as the RSI and MACD signal weak momentum.
Gold (XAU/USD) starts the week on a bearish note, snapping a two-day winning streak as expectations of additional Federal Reserve (Fed) rate hikes and a firmer US Dollar (USD) limit the upside. At the time of writing, XAU/USD trades around $4,350, down nearly 0.60% on the day.
However, the metal lacks strong follow-through selling as falling Oil prices keep US Treasury yields below last week’s multi-year highs. West Texas Intermediate (WTI) Oil trades around $93.50, its lowest level in more than a week, and is on track to fall for a fourth straight day.
Oil prices are under pressure amid signs of diplomatic efforts surrounding the war in the Middle East and improving energy flows from Saudi Arabia.
US President Donald Trump said he would “probably” be open to meeting Iranian President Masoud Pezeshkian on the sidelines of the United Nations General Assembly this week. Trump could also hold talks with other Persian Gulf leaders.
Iranian security chief Mohsen Rezaei said Tehran has sent its conditions to the United States through international mediators. However, he also warned that Iran would respond strongly if the US launches another attack. Meanwhile, Iran-backed Houthis and Saudi forces remain engaged in fighting.
For Gold, US interest-rate expectations, the US Dollar, bond yields, crude Oil prices and geopolitical developments remain the main drivers of price action. Energy prices are still well above pre-war levels and continue to add to inflationary pressure.
The energy shock has pushed major central banks towards tighter monetary policy, with the Fed raising interest rates by 25 basis points (bps) last week. Higher borrowing costs usually weigh on non-yielding assets such as Gold by making interest-bearing investments more attractive.
Traders are anticipating additional Fed rate hikes and are already pricing in a meaningful chance of another increase in October. The updated dot plot also points to at least one more rate hike this year. The prospect of tighter policy supports the US Dollar and keeps Treasury yields elevated, creating a difficult backdrop for Gold.
The US Dollar Index (DXY), which tracks the Greenback against a basket of six major currencies, trades around 100.30, below the seven-week high of 100.56 touched on Friday.
Looking ahead, the US economic calendar is relatively light this week. The main releases are preliminary S&P Global Purchasing Managers' Index (PMI) data and the University of Michigan (UoM) Consumer Sentiment survey for September. Markets will also watch a busy schedule of Fed speakers for fresh clues about the future policy path.
Technical Analysis: XAU/USD remains range-bound near Bollinger middle band
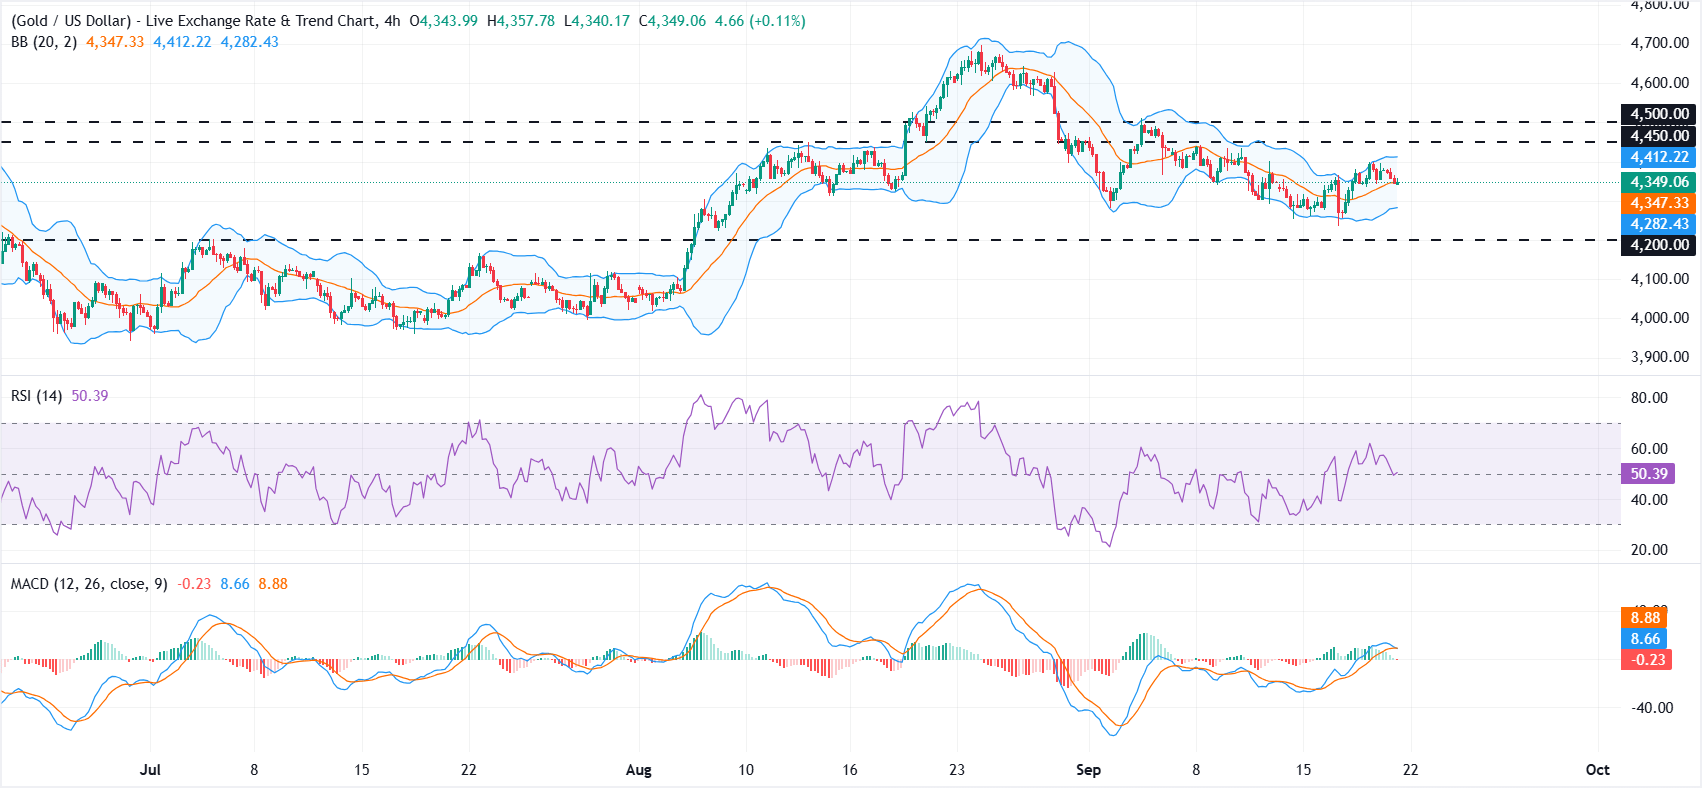
On the four-hour chart, XAU/USD hovers just above the 20-period Bollinger Simple Moving Average at roughly $4,347, leaving the near-term bias neutral as price consolidates between nearby band support and overhead resistance. The upper Bollinger band around $4,412 caps the topside for now, suggesting upside attempts remain constrained while momentum normalizes, with the Relative Strength Index near 51 and the Moving Average Convergence Divergence (MACD) flat around the zero line hinting at a loss of directional conviction.
On the downside, initial support emerges at the mid-Bollinger band near $4,347, ahead of the lower band around $4,282 and a more substantial floor at $4,200. On the topside, immediate resistance is seen at the upper Bollinger band near $4,412, followed by a horizontal barrier at $4,450 and then $4,500, where a break higher would be needed to reassert a stronger bullish continuation on the four-hour timeframe.
(The technical analysis of this story was written with the help of an AI tool. Know more.)
Gold FAQs
Gold has played a key role in human’s history as it has been widely used as a store of value and medium of exchange. Currently, apart from its shine and usage for jewelry, the precious metal is widely seen as a safe-haven asset, meaning that it is considered a good investment during turbulent times. Gold is also widely seen as a hedge against inflation and against depreciating currencies as it doesn’t rely on any specific issuer or government.
Central banks are the biggest Gold holders. In their aim to support their currencies in turbulent times, central banks tend to diversify their reserves and buy Gold to improve the perceived strength of the economy and the currency. High Gold reserves can be a source of trust for a country’s solvency. Central banks added 1,136 tonnes of Gold worth around $70 billion to their reserves in 2022, according to data from the World Gold Council. This is the highest yearly purchase since records began. Central banks from emerging economies such as China, India and Turkey are quickly increasing their Gold reserves.
Gold has an inverse correlation with the US Dollar and US Treasuries, which are both major reserve and safe-haven assets. When the Dollar depreciates, Gold tends to rise, enabling investors and central banks to diversify their assets in turbulent times. Gold is also inversely correlated with risk assets. A rally in the stock market tends to weaken Gold price, while sell-offs in riskier markets tend to favor the precious metal.
The price can move due to a wide range of factors. Geopolitical instability or fears of a deep recession can quickly make Gold price escalate due to its safe-haven status. As a yield-less asset, Gold tends to rise with lower interest rates, while higher cost of money usually weighs down on the yellow metal. Still, most moves depend on how the US Dollar (USD) behaves as the asset is priced in dollars (XAU/USD). A strong Dollar tends to keep the price of Gold controlled, whereas a weaker Dollar is likely to push Gold prices up.
Recommended Articles


