


Gold bulls flinch as NFP puts Fed hawks back in the driver’s seat
- Strong NFP lifts September Fed hike odds.
- Hormuz tanker strikes keep energy-linked inflation fears alive.
- PPI, CPI and sentiment data drive next Gold catalyst.
Gold (XAU/USD) price dives over 0.40% on Monday following last Friday’s US jobs report, which ignited speculation that the Federal Reserve (Fed) might resume its tightening cycle if inflation reaccelerates late this week, while the labor market remains solid. The XAU/USD pair trades at $4,412 after reaching a daily high of $4,435.
XAU/USD falls as strong payrolls put inflation data center stage
The US Nonfarm Payrolls exceeded forecasts on Friday. August’s employment smashed forecasts of 56K, coming in at 162K, while July’s print was upwardly revised from -23K to 21K. The same data showed that the Unemployment Rate was steady at 4.1%.
Following the report, US Treasury yields rose, pushing the US Dollar higher. The US Dollar Index (DXY), which measures the performance of the Greenback versus a basket of six currencies, is down 0.25% at 98.91.
The reaction was sparked by money markets raising the odds of a Federal Reserve interest rate hike at the September 15-16 meeting to 60%, as reported by Prime Terminal.
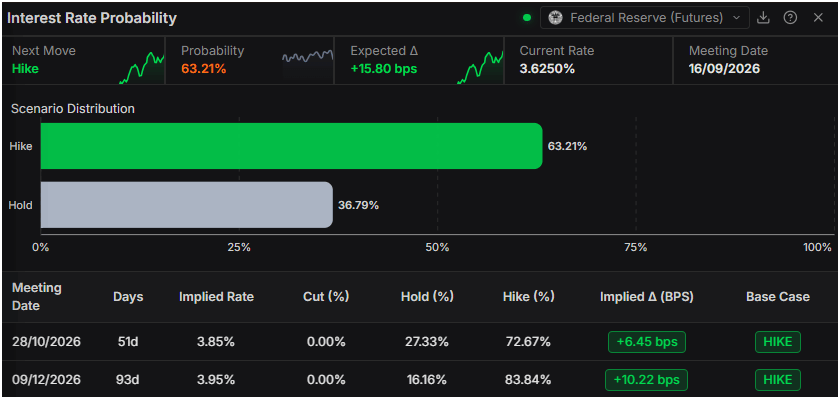
On Thursday, traders will eye the release of US producer-side data, followed by the Consumer Price Index (CPI) on Friday.
On Saturday, the US conducted strikes on three Iranian tankers in response to the IRGC's ballistic missile attack on US Navy ships. Iran’s navy stated it targeted oil vessels moving through unauthorized routes in the Strait, along with three other US-flagged ships elsewhere.
Meanwhile, US President Donald Trump began to exert pressure on Washington’s Fed, saying that unless the Fed cut interest rates, something that he demanded previously, he would stop trading with countries with which the US has a deficit.
This week, the US economic schedule will feature the release of the Producer Price Index (PPI), the Consumer Price Index (CPI), jobless claims data, the US Monthly Budget Statement, and the University of Michigan Consumer Sentiment for September.
XAU/USD technical outlook: Gold trapped within 100- and 200-day SMAs
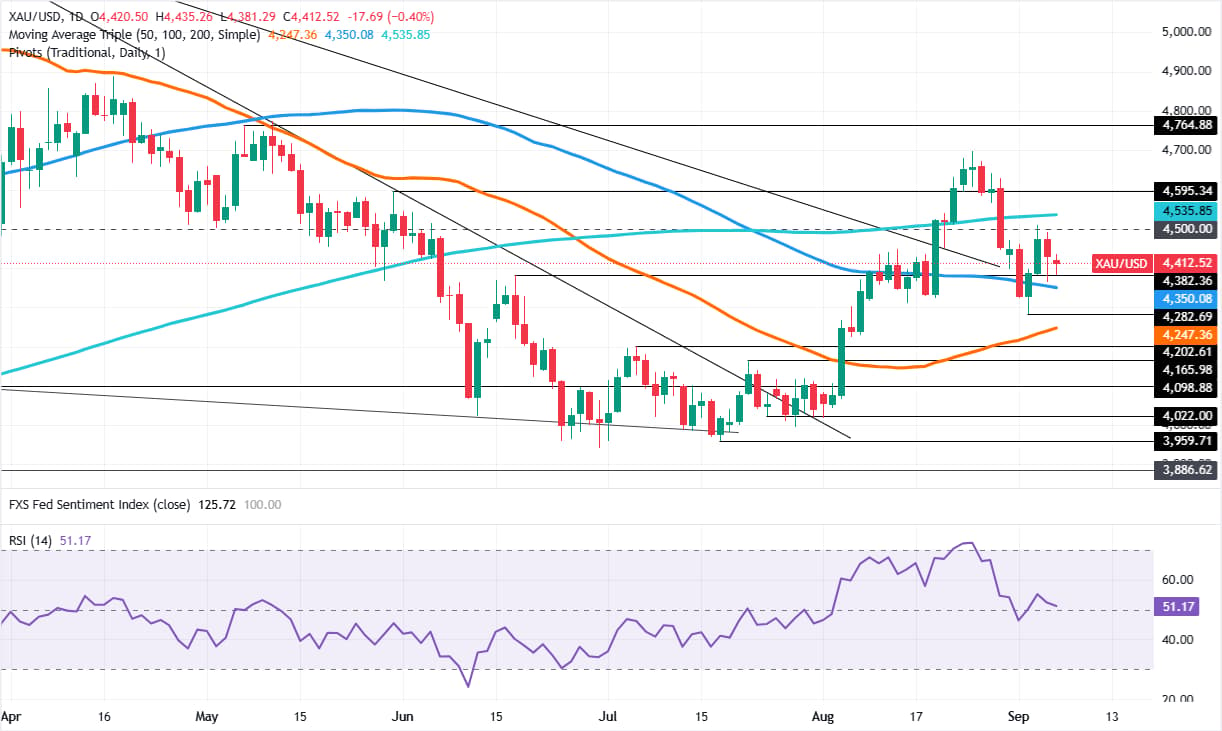
Gold price has reversed course, though price action shifted more narrowly due to thin volume. As of writing, the yellow metal found support at the 100-day Simple Moving Average (SMA) at $4,350, followed by the $4,500 level above.
The Relative Strength Index (RSI) is neutral to downward-trending, hinting that, in the near term, a leg down is on the cards.
Downwards, the first support is seen at $4,400. A decisive breakout will expose the 100-day SMA, with the next support at $4,300 and the September 2 swing low of $4,282.
On the upside, XAU/USD's next area of interest past $4,500 is the 200-day SMA at $4,535. A breach of the latter will expose $4,600, followed by the August 25 daily high at $4,697.
Gold FAQs
Gold has played a key role in human’s history as it has been widely used as a store of value and medium of exchange. Currently, apart from its shine and usage for jewelry, the precious metal is widely seen as a safe-haven asset, meaning that it is considered a good investment during turbulent times. Gold is also widely seen as a hedge against inflation and against depreciating currencies as it doesn’t rely on any specific issuer or government.
Central banks are the biggest Gold holders. In their aim to support their currencies in turbulent times, central banks tend to diversify their reserves and buy Gold to improve the perceived strength of the economy and the currency. High Gold reserves can be a source of trust for a country’s solvency. Central banks added 1,136 tonnes of Gold worth around $70 billion to their reserves in 2022, according to data from the World Gold Council. This is the highest yearly purchase since records began. Central banks from emerging economies such as China, India and Turkey are quickly increasing their Gold reserves.
Gold has an inverse correlation with the US Dollar and US Treasuries, which are both major reserve and safe-haven assets. When the Dollar depreciates, Gold tends to rise, enabling investors and central banks to diversify their assets in turbulent times. Gold is also inversely correlated with risk assets. A rally in the stock market tends to weaken Gold price, while sell-offs in riskier markets tend to favor the precious metal.
The price can move due to a wide range of factors. Geopolitical instability or fears of a deep recession can quickly make Gold price escalate due to its safe-haven status. As a yield-less asset, Gold tends to rise with lower interest rates, while higher cost of money usually weighs down on the yellow metal. Still, most moves depend on how the US Dollar (USD) behaves as the asset is priced in dollars (XAU/USD). A strong Dollar tends to keep the price of Gold controlled, whereas a weaker Dollar is likely to push Gold prices up.
Recommended Articles


