


Gold price surges above $2,400, eyeing all-time highs
- Gold breaks above $2,400, nearing all-time high of $2,431.
- Lower April inflation in the US supports Gold’s rally, despite rising Treasury yields.
- Fed officials remain cautious, with December 2024 rate cut expectations slightly adjusted to 35 bps.
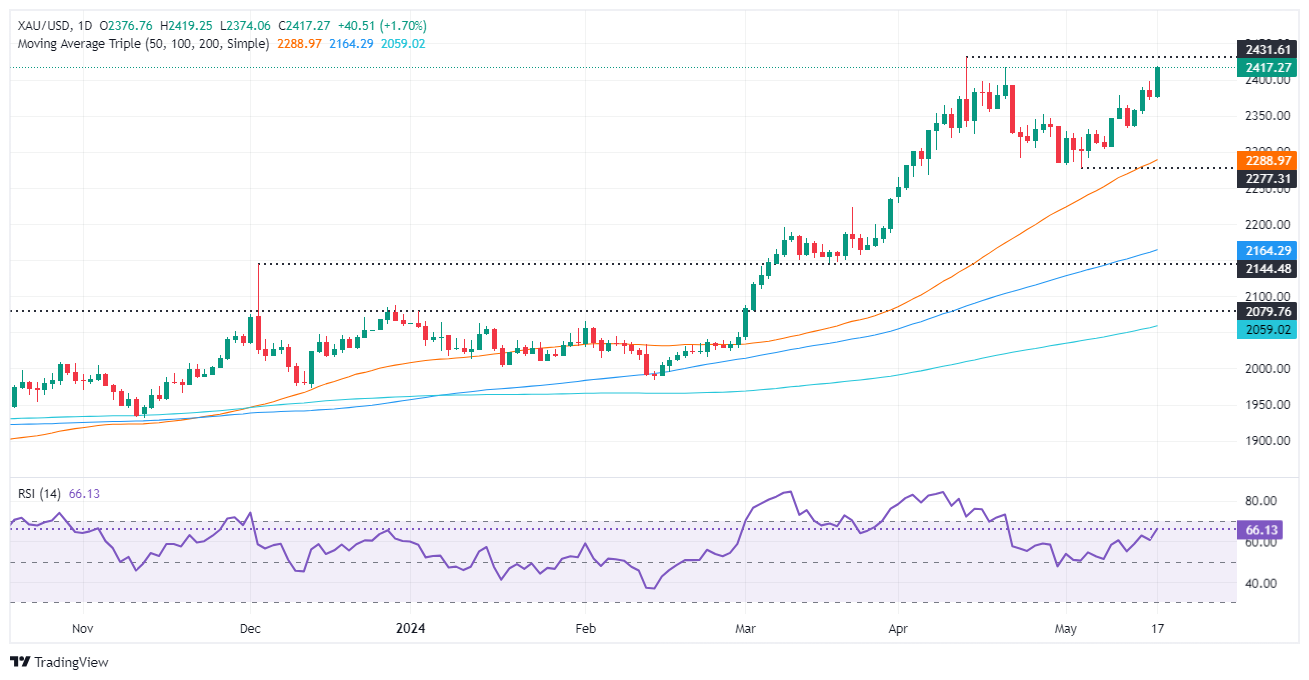
Gold's price skyrocketed during the North American session ahead of the weekend as XAU/USD traded above $2,400, posting gains of more than 1.5% amid higher US Treasury bond yields. The non-yielding metal extended its advancement and threatened to crack the all-time high of $2,431.
A lower April inflationary reading in the United States (US) sponsored Gold’s leg up above the $2,400 mark, although US Treasury yields climbed. However, the Greenback is battered across the board and tumbled some 0.03%, according to the US Dollar Index (DXY), standing at 104.45.
That revived speculation that the Federal Reserve (Fed) could lower rates in 2024. However, Fed officials stressed that one positive read for inflation is not enough with most regional Fed presidents maintaining a cautious stance.
According to the fed funds rate December 2024 futures contract, expectations that the Fed would lower rates dropped from 36 basis points (bps) to 35 bps toward the end of the year.
Daily digest market movers: Gold price ignores hawkish Fed comments to keep rates higher
- Gold prices advanced despite higher US Treasury yields and a weaker US Dollar. The US 10-year Treasury note yields 4.42% and is up four-and-a-half basis points (bps) from its opening level. DXY dropped 0.04% to 104.40.
- On Wednesday, US inflation resumed its downtrend after stalling for six months, according to the US Bureau of Labor Statistics (BLS). The core Consumer Price Index (CPI) ebbed lower from 3.8% to 3.6% YoY in April, easing pressure on the Fed. This and soft Retail Sales augmented the odds for rate cut expectations by the Fed.
- After the data, US equities rallied to new all-time highs, while the Greenback tumbled sharply, following the path of US Treasury yields.
- Richmond Fed President Thomas Barkin acknowledged that inflation is decreasing but emphasized that it will "take more time" to reach the Fed’s target.
- Cleveland Fed President Loretta Mester approved the latest CPI data, noting that the Fed's current monetary policy stance is appropriate as it continues to assess forthcoming economic data.
- Fed Governor Michelle Bowman said the policy is restrictive but is willing to raise rates if inflation stalls or reverses.
Technical analysis: Gold price to extend its rally toward $2,500
Gold price’s bullish bias remains intact as the golden metal resumed its uptrend. Gold buyers gather strength with the momentum on their side as the Relative Strength Index (RSI) stays in bullish territory.
Therefore, the most likely scenario is that XAU/USD might test the all-time high of $2,431. Once cleared, the next stop would be the $2,450 mark, followed by the psychological $2,500 figure.
Conversely, if XAU/USD retreats below $2,400, that could expose the May 13 low at $2,332, followed by the May 8 low of $2,303. Once those levels are surpassed, the 50-day Simple Moving Average (SMA) at $2,284 will be up next.
Gold FAQs
Gold has played a key role in human’s history as it has been widely used as a store of value and medium of exchange. Currently, apart from its shine and usage for jewelry, the precious metal is widely seen as a safe-haven asset, meaning that it is considered a good investment during turbulent times. Gold is also widely seen as a hedge against inflation and against depreciating currencies as it doesn’t rely on any specific issuer or government.
Central banks are the biggest Gold holders. In their aim to support their currencies in turbulent times, central banks tend to diversify their reserves and buy Gold to improve the perceived strength of the economy and the currency. High Gold reserves can be a source of trust for a country’s solvency. Central banks added 1,136 tonnes of Gold worth around $70 billion to their reserves in 2022, according to data from the World Gold Council. This is the highest yearly purchase since records began. Central banks from emerging economies such as China, India and Turkey are quickly increasing their Gold reserves.
Gold has an inverse correlation with the US Dollar and US Treasuries, which are both major reserve and safe-haven assets. When the Dollar depreciates, Gold tends to rise, enabling investors and central banks to diversify their assets in turbulent times. Gold is also inversely correlated with risk assets. A rally in the stock market tends to weaken Gold price, while sell-offs in riskier markets tend to favor the precious metal.
The price can move due to a wide range of factors. Geopolitical instability or fears of a deep recession can quickly make Gold price escalate due to its safe-haven status. As a yield-less asset, Gold tends to rise with lower interest rates, while higher cost of money usually weighs down on the yellow metal. Still, most moves depend on how the US Dollar (USD) behaves as the asset is priced in dollars (XAU/USD). A strong Dollar tends to keep the price of Gold controlled, whereas a weaker Dollar is likely to push Gold prices up.
Recommended Articles


