

GBP/USD churns near familiar levels ahead of Friday’s PMI data
- GBP/USD spun in a slow circle on Thursday as Cable traders await fresh data.
- It’s been a quiet week on the economic calendar for the Pound Sterling.
- Global PMI data is due on Friday, but mixed prints are expected.
GBP/USD coiled near the 1.3550 level on Thursday as Cable traders functionally ignored a thin economic calendar and a lack of meaningful information to push the pair decisively in either direction. Headlines from US President Donald Trump ruled the roost on most traders’ newsfeeds, but the broader market impact remains limited as Trump struggles to pick an overall objective.
President Donald Trump lashed out about a wide variety of topics during his appearance at the WEF’s annual gathering in Switzerland, colloquially referred to as Davos, the city that hosts the forum every year. President Trump reminded everyone listening that he intended to “obliterate” the US budget deficit, while somehow convincing the US Congress to pass “the largest tax cut in American history” at the same time. Donald Trump also vowed to attempt to subvert the operational independence of the US Federal Reserve (Fed) by demanding lower interest rates.
S&P Global PMI figures are due on both sides of the Atlantic on Friday and show changes in the aggregated respondent results of business operators across the economy. Both UK and US PMI business activity survey results for January are expected to come in mixed this week, with the services components expected to tick down and manufacturing to recover, albeit slightly. PMI figures generally have a limited impact unless figures come in wildly out of sync with forecasts, but survey respondent rates tend to be on the low side, and the overall figures should be taken with a grain of salt.
GBP/USD price forecast
GBP/USD continues to reach for, but fall just shy of, the 1.2400 handle as price action gets swamped out near 1.2350. Bullish momentum is poised to run out of gas with the pair struggling to make further headway, though bids are holding around 2% above the pair’s 15-month low priced in near 1.2100 a couple of weeks ago.
Price action has established strong technical support around the 1.2200 area, but a downward-sloping 50-day Exponential Moving Average (EMA) near 1.2500 is hindering the development of sustained bullish movements.
GBP/USD daily chart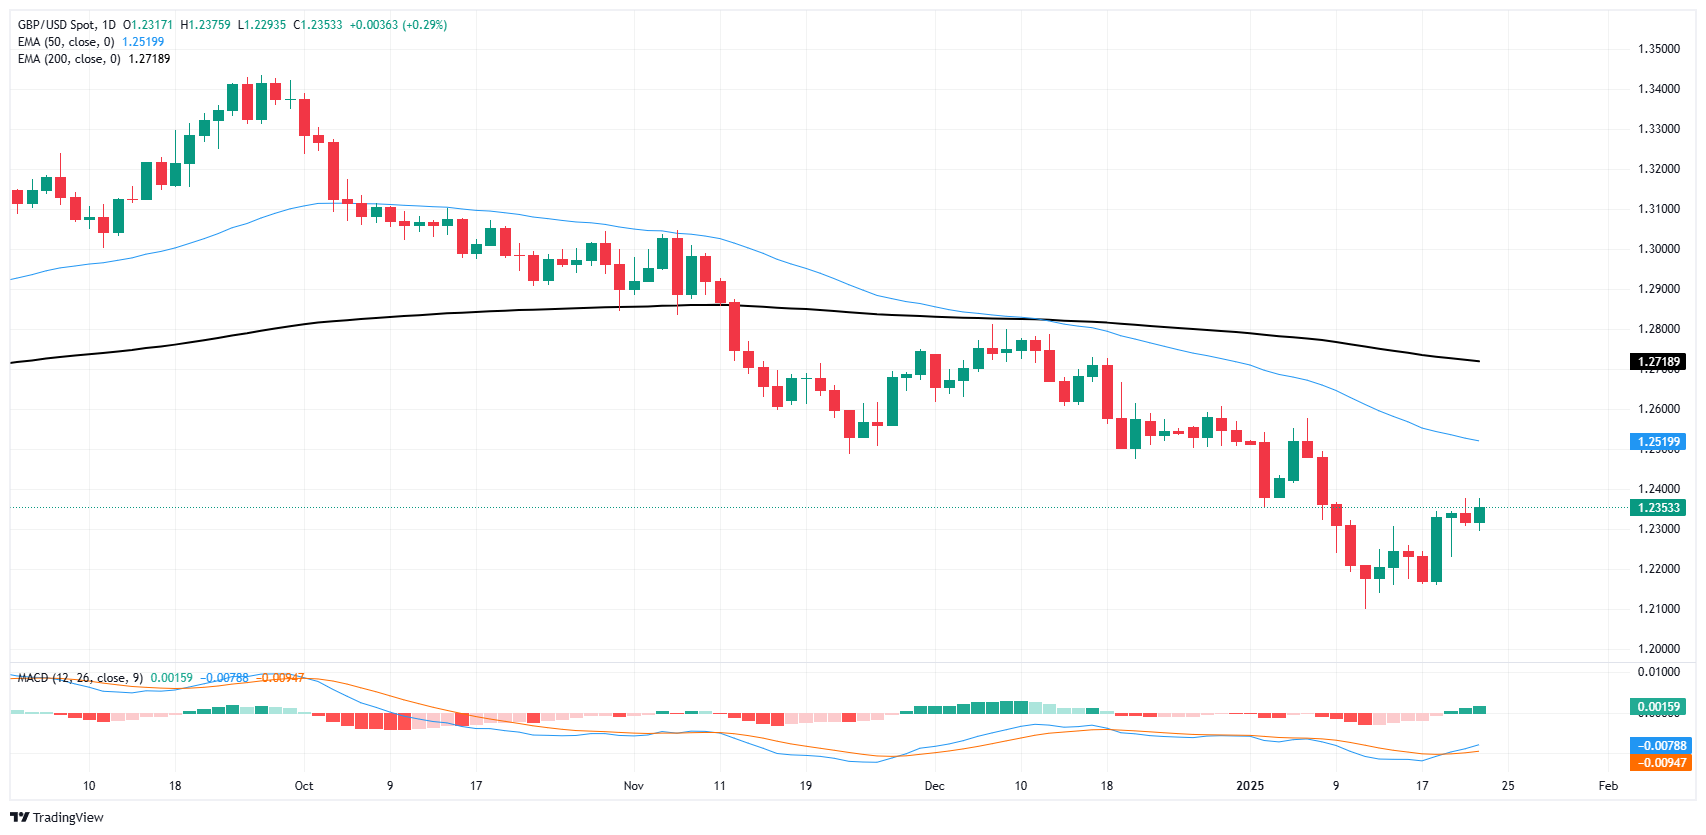
Pound Sterling FAQs
The Pound Sterling (GBP) is the oldest currency in the world (886 AD) and the official currency of the United Kingdom. It is the fourth most traded unit for foreign exchange (FX) in the world, accounting for 12% of all transactions, averaging $630 billion a day, according to 2022 data. Its key trading pairs are GBP/USD, also known as ‘Cable’, which accounts for 11% of FX, GBP/JPY, or the ‘Dragon’ as it is known by traders (3%), and EUR/GBP (2%). The Pound Sterling is issued by the Bank of England (BoE).
The single most important factor influencing the value of the Pound Sterling is monetary policy decided by the Bank of England. The BoE bases its decisions on whether it has achieved its primary goal of “price stability” – a steady inflation rate of around 2%. Its primary tool for achieving this is the adjustment of interest rates. When inflation is too high, the BoE will try to rein it in by raising interest rates, making it more expensive for people and businesses to access credit. This is generally positive for GBP, as higher interest rates make the UK a more attractive place for global investors to park their money. When inflation falls too low it is a sign economic growth is slowing. In this scenario, the BoE will consider lowering interest rates to cheapen credit so businesses will borrow more to invest in growth-generating projects.
Data releases gauge the health of the economy and can impact the value of the Pound Sterling. Indicators such as GDP, Manufacturing and Services PMIs, and employment can all influence the direction of the GBP. A strong economy is good for Sterling. Not only does it attract more foreign investment but it may encourage the BoE to put up interest rates, which will directly strengthen GBP. Otherwise, if economic data is weak, the Pound Sterling is likely to fall.
Another significant data release for the Pound Sterling is the Trade Balance. This indicator measures the difference between what a country earns from its exports and what it spends on imports over a given period. If a country produces highly sought-after exports, its currency will benefit purely from the extra demand created from foreign buyers seeking to purchase these goods. Therefore, a positive net Trade Balance strengthens a currency and vice versa for a negative balance.
Recommended Articles


