

GBP/JPY climbs into another peak as Yen continues to decline
- GBP/JPY marches to a fresh 16-year high above 204.00.
- Guppy taps highest bids since August of 2008.
- UK heads into Parliamentary elections later this week.
GBP/JPY tipped into yet another 16-year high on Monday, peaking at 204.75 as the Yen continues to deteriorate across the board. Investors are snubbing a continuous stream of intervention rhetoric from the Bank of Japan (BoJ) and Japan’s Ministry of Finance (MoF). With the BoJ stubbornly entrenched in a hyper-easy monetary policy stance, the Yen is set to continue declining as the interest rate differential between the Yen and other major currencies shows no signs of narrowing.
Economic data remains thin for both the Yen and the Pound Sterling this week, leaving GBP traders to focus on the UK’s upcoming Parliamentary elections slated for Thursday. Japan’s Tankan Large Manufacturing Index rose to 13.0 in Q2, up from the previous quarter’s 11.0.
Q1 UK Gross Domestic Product (GDP) rose to 0.7% QoQ last Friday, clipping above the forecast hold at 0.6%, bolstering the Pound Sterling. Japanese Tokyo Consumer Price Index (CPI) inflation also increased to 2.3% YoY through June compared to the previous 2.2%, but the figure wasn’t enough to spark any signs of hawkishness from the BoJ.
GBP/JPY technical outlook
The Guppy has accelerated into the top end as bidding pressure continues to build, clipping into a fresh 16-year peak at 204.75. GBP/JPY has closed in the green for eleven consecutive trading days.
The pair has climbed 14.55% bottom-to-top from 2024’s early low bids of 178.14, and one-sided price action has dragged GBP/JPY deep into bull country. The pair has no meaningful technical resistance levels overhead, and the pair is trading well into the north side of the 200-day Exponential Moving Average (EMA) at 190.35.
GBP/JPY hourly chart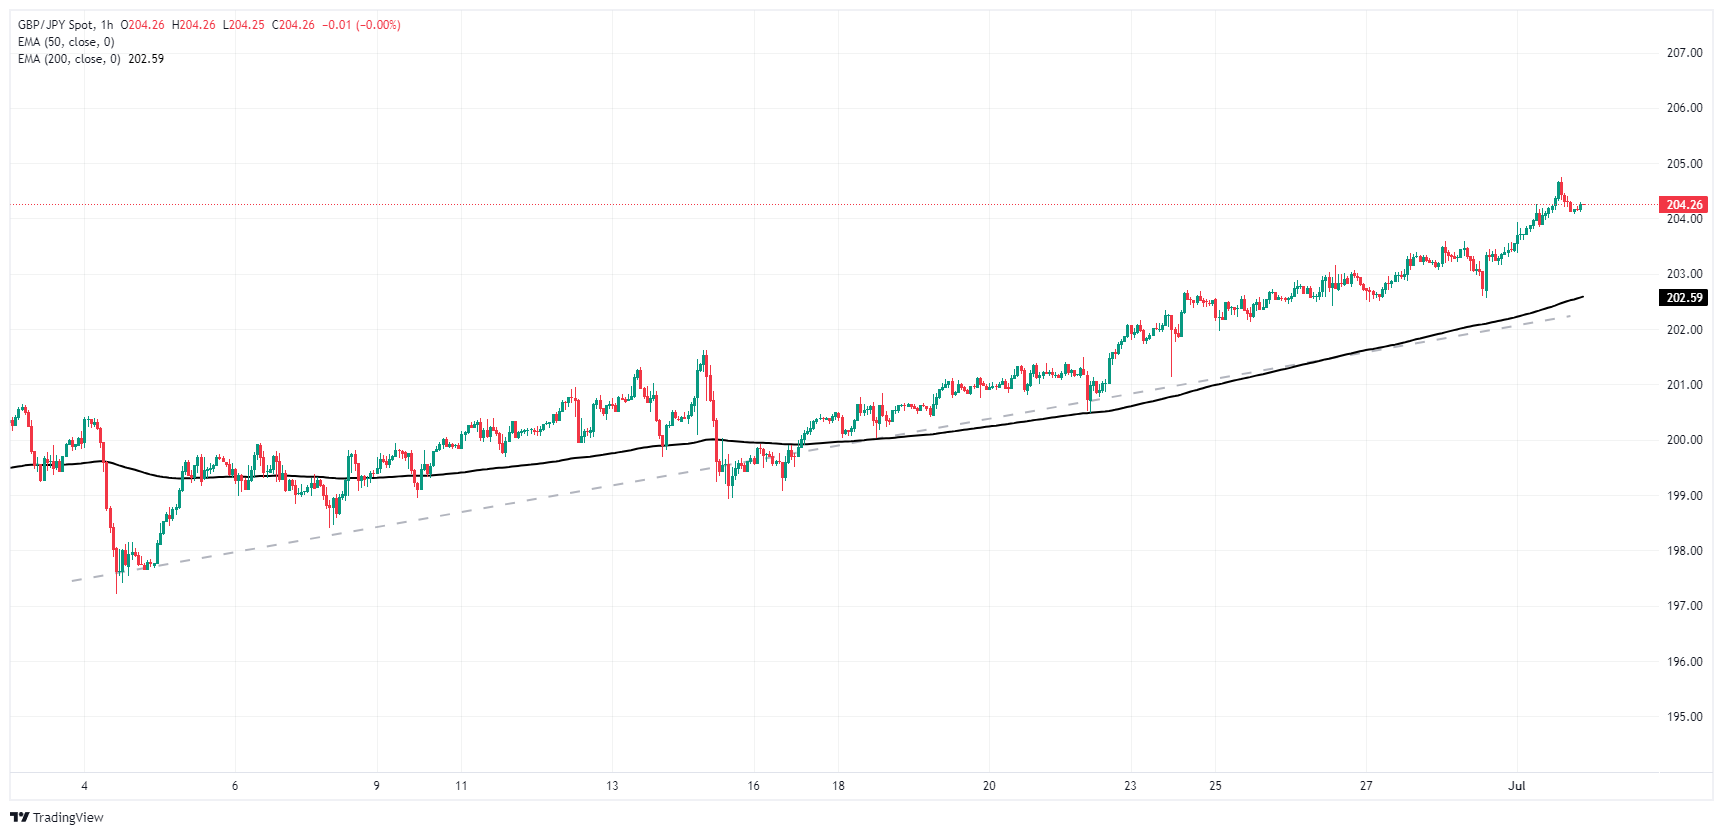
GBP/JPY daily chart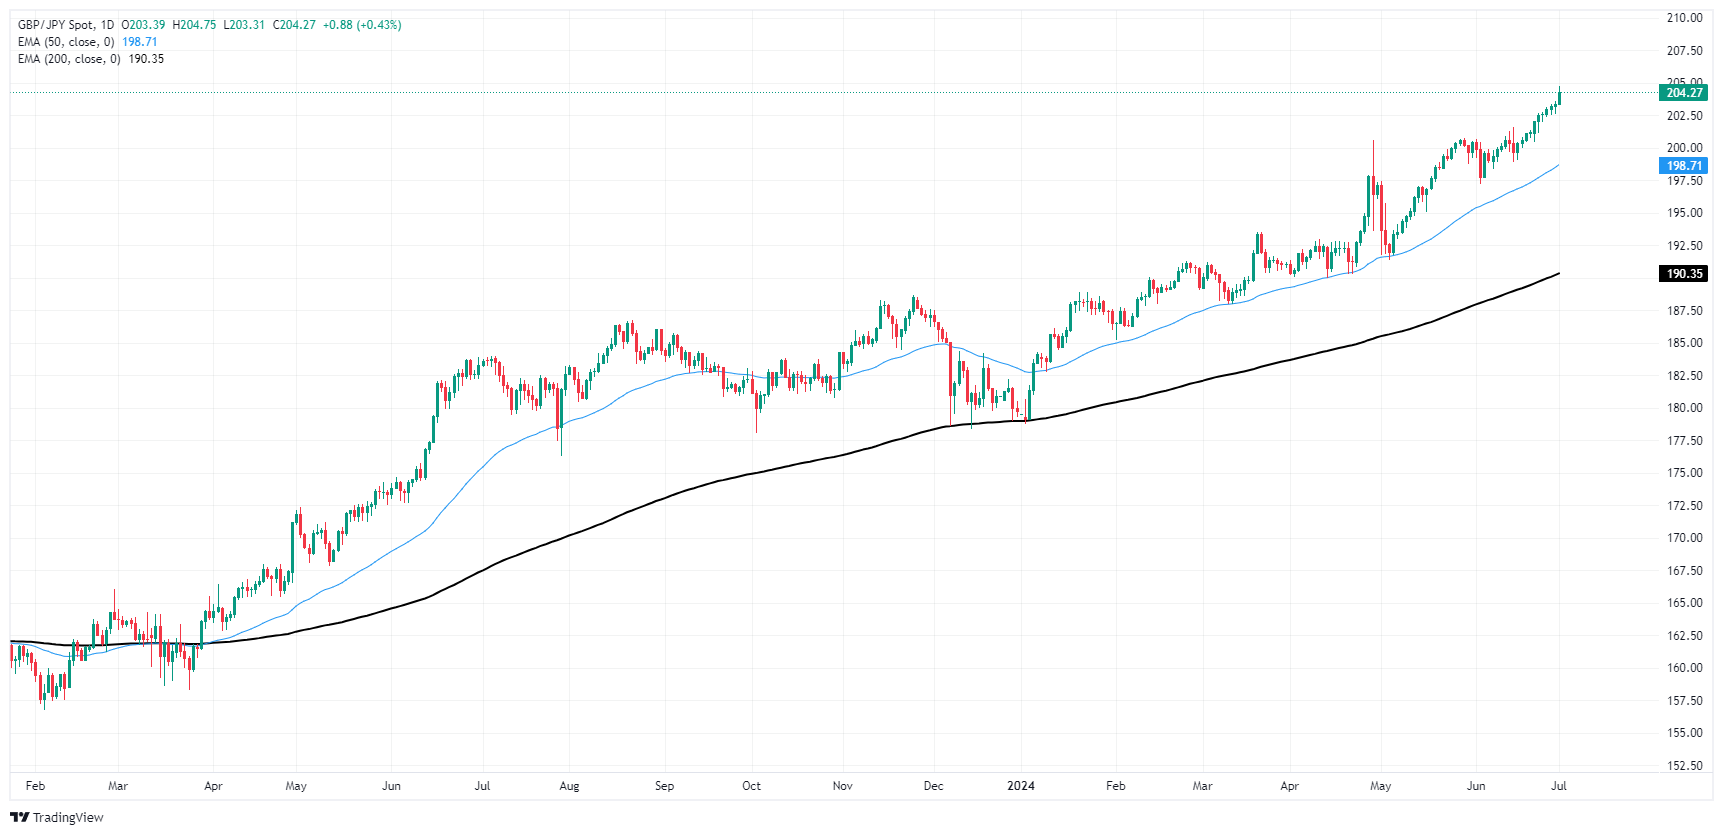
Pound Sterling FAQs
The Pound Sterling (GBP) is the oldest currency in the world (886 AD) and the official currency of the United Kingdom. It is the fourth most traded unit for foreign exchange (FX) in the world, accounting for 12% of all transactions, averaging $630 billion a day, according to 2022 data. Its key trading pairs are GBP/USD, aka ‘Cable’, which accounts for 11% of FX, GBP/JPY, or the ‘Dragon’ as it is known by traders (3%), and EUR/GBP (2%). The Pound Sterling is issued by the Bank of England (BoE).
The single most important factor influencing the value of the Pound Sterling is monetary policy decided by the Bank of England. The BoE bases its decisions on whether it has achieved its primary goal of “price stability” – a steady inflation rate of around 2%. Its primary tool for achieving this is the adjustment of interest rates. When inflation is too high, the BoE will try to rein it in by raising interest rates, making it more expensive for people and businesses to access credit. This is generally positive for GBP, as higher interest rates make the UK a more attractive place for global investors to park their money. When inflation falls too low it is a sign economic growth is slowing. In this scenario, the BoE will consider lowering interest rates to cheapen credit so businesses will borrow more to invest in growth-generating projects.
Data releases gauge the health of the economy and can impact the value of the Pound Sterling. Indicators such as GDP, Manufacturing and Services PMIs, and employment can all influence the direction of the GBP. A strong economy is good for Sterling. Not only does it attract more foreign investment but it may encourage the BoE to put up interest rates, which will directly strengthen GBP. Otherwise, if economic data is weak, the Pound Sterling is likely to fall.
Another significant data release for the Pound Sterling is the Trade Balance. This indicator measures the difference between what a country earns from its exports and what it spends on imports over a given period. If a country produces highly sought-after exports, its currency will benefit purely from the extra demand created from foreign buyers seeking to purchase these goods. Therefore, a positive net Trade Balance strengthens a currency and vice versa for a negative balance.
Recommended Articles


