


Australian Dollar finds cushion near 0.6710 against US Dollar, outlook still worsen
- The Australian Dollar attracts some buds near 0.6710 against the US Dollar.
- The RBA seems hesitant to support more interest rate hikes amid growing economic risks.
- Fears of a series of Fed interest rate hikes have underpinned the US Dollar.
The Australian Dollar (AUD) finds a temporary support near 0.6710 against the US Dollar (USD) and rebounds to near 0.6735 during the European trade on Wednesday. The Aussie pair rebounds as the Australian currency recovers its major early losses; however, the outlook is uncertain amid hopes that the Reserve Bank of Australia’s (RBA) monetary policy cycle has come to an end.
The remarks from the RBA have signaled that the bar of another interest rate hike is very high after raising them five times so far this year, citing downside economic risks.
RBA seen cautious after hike above neutral as downside risks flagged
Analysts at Commerzbank note that the latest RBA minutes “underscore once again that the threshold for another rate hike is likely to be rather high,” after the central bank recently lifted its policy rate to 4.85%, “its highest level since the global financial crisis in 2008.” They stress that this setting is “already well above the RBA’s estimate of the neutral rate of around 3-4%,” reinforcing the impression that policymakers are reluctant to tighten further. Commerzbank highlights that “the three members who voted against the latest rate hike warned that the economy could already be close to a sharper downturn,” a signal which, in their view, “suggests that the RBA is likely to be cautious about further rate hikes for now.”
Going forward, the next major trigger for the Australian Dollar will be the labor market data for October, which is scheduled for Thursday. The Unemployment Rate is expected to have remained steady at 4.7%. Meanwhile, fresh addition of workers is seen at 25.2K after laying off 39.3K in September.
Meanwhile, the US Dollar outperforms as the Federal Reserve (Fed) is expected to have entered a prolonged monetary tightening cycle.
In the European trade, the US Dollar Index (DXY), which gauges the Greenback’s value against six major currencies, hits a fresh 19-month high at around 103.86.
US Dollar Price Today
The table below shows the percentage change of US Dollar (USD) against listed major currencies today. US Dollar was the strongest against the Euro.
| USD | EUR | GBP | JPY | CAD | AUD | NZD | CHF | |
|---|---|---|---|---|---|---|---|---|
| USD | 0.34% | 0.33% | -0.03% | 0.12% | 0.08% | -0.05% | 0.24% | |
| EUR | -0.34% | -0.02% | -0.35% | -0.23% | -0.26% | -0.40% | -0.10% | |
| GBP | -0.33% | 0.02% | -0.34% | -0.22% | -0.25% | -0.38% | -0.08% | |
| JPY | 0.03% | 0.35% | 0.34% | 0.13% | 0.09% | -0.04% | 0.26% | |
| CAD | -0.12% | 0.23% | 0.22% | -0.13% | -0.04% | -0.17% | 0.13% | |
| AUD | -0.08% | 0.26% | 0.25% | -0.09% | 0.04% | -0.13% | 0.16% | |
| NZD | 0.05% | 0.40% | 0.38% | 0.04% | 0.17% | 0.13% | 0.31% | |
| CHF | -0.24% | 0.10% | 0.08% | -0.26% | -0.13% | -0.16% | -0.31% |
The heat map shows percentage changes of major currencies against each other. The base currency is picked from the left column, while the quote currency is picked from the top row. For example, if you pick the US Dollar from the left column and move along the horizontal line to the Japanese Yen, the percentage change displayed in the box will represent USD (base)/JPY (quote).
Analysts at MUFG observe that the US Dollar “hit a new high as market participants continue to position for a series of Fed rate hikes” despite a “large drop in crude oil prices and some diminished enthusiasm for all things AI-related.”
Looking ahead, ING wrote that “the minutes of the FOMC meeting in October will be released this evening and will likely reflect the growing consensus amongst FOMC members that there is more work to do, signalling further rate hikes in Q1 next year.”
AUD/USD Technical Analysis
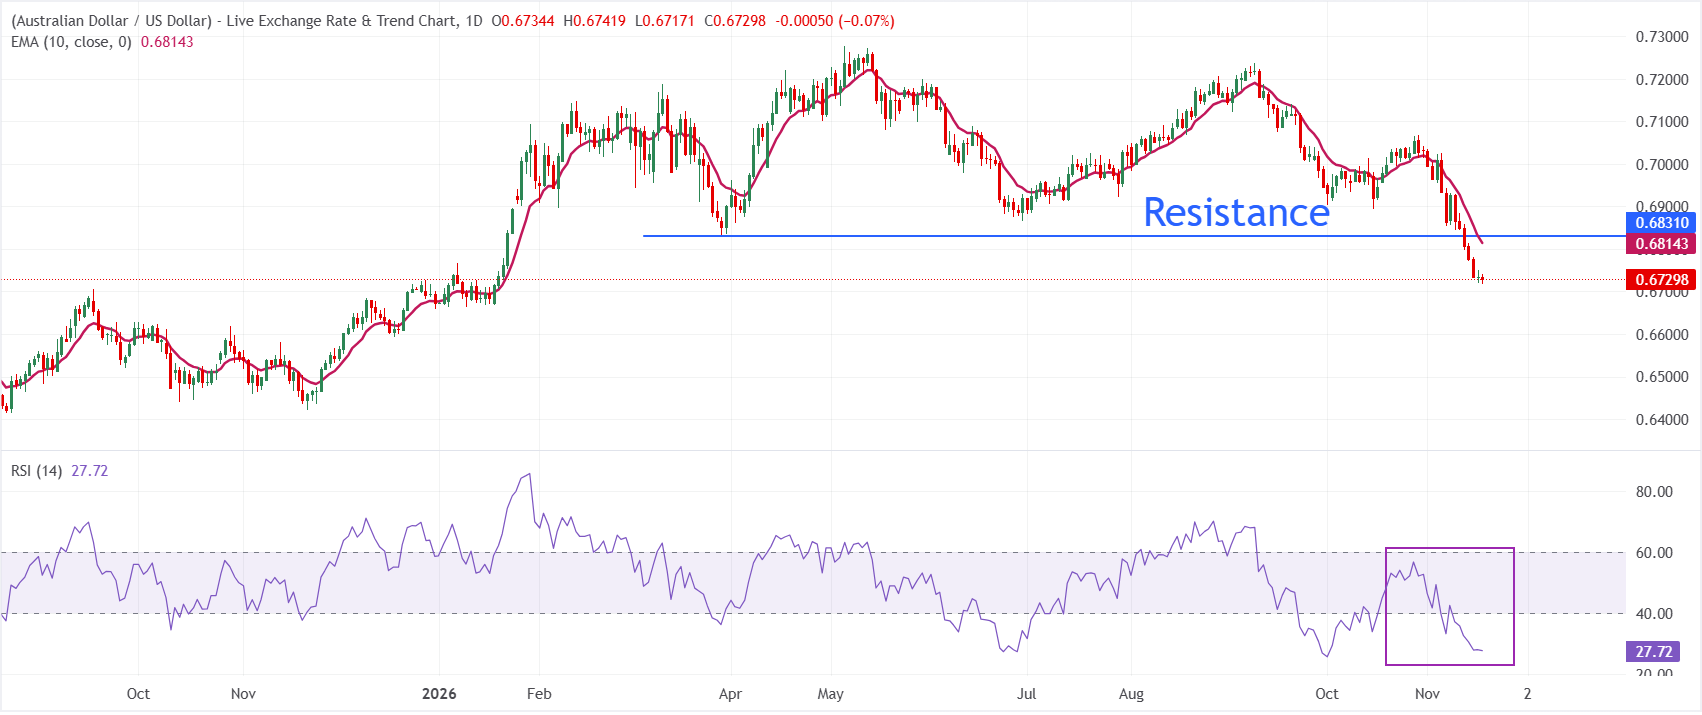
In the daily chart, AUD/USD trades at 0.6730, maintaining a bearish near-term bias as it holds beneath the 10-day exponential moving average (EMA) at 0.6814. The pair has extended its decline from the recent highs and is now trading well below this short-term trend gauge, suggesting sellers remain in control, while the Relative Strength Index (RSI) at 27.7 sits in oversold territory, hinting that the downside momentum could be stretched but not yet reversed.
On the topside, initial resistance is located at the 10-day EMA around 0.6814, where a daily close above would be needed to ease immediate selling pressure and open scope for a deeper corrective rebound. Until that barrier is reclaimed, AUD/USD is likely to stay vulnerable to further weakness, with the absence of nearby structural supports on the chart leaving the pair exposed to fresh lows if bearish pressure resumes.
(The technical analysis of this story was written with the help of an AI tool. Know more.)
Economic Indicator
Employment Change s.a.
The Employment Change released by the Australian Bureau of Statistics is a measure of the change in the number of employed people in Australia. The statistic is adjusted to remove the influence of seasonal trends. Generally speaking, a rise in Employment Change has positive implications for consumer spending, stimulates economic growth, and is bullish for the Australian Dollar (AUD). A low reading, on the other hand, is seen as bearish.
Read more.Next release: Thu Nov 19, 2026 00:30
Frequency: Monthly
Consensus: 25.2K
Previous: -39.3K
Source: Australian Bureau of Statistics
Recommended Articles


