


United States Dollar index struggles to extend rally beyond 103.80, FOMC Minutes eyed
- The US Dollar Index flattens at around 103.60 after giving up its opening gains.
- Nvidia posts bumper Q3 results and clarified that the business is usual despite Jensen Huang's exit.
- Investors keenly await FOMC minutes of the October policy meeting.
The US Dollar (USD) turns flat in the early trade on Wednesday after giving back its mild early gains. As of writing, the US Dollar Index (DXY), which gauges the Greenback’s value against six major currencies, trades almost flat at around 103.60.
From the previous day, the USD Index has been facing pressure in an attempt to extend the rally beyond 103.80, suggesting that the upside run has hit a roadblock.
The USD Index struggles to extend gains as bumper quarterly results from Nvidia after the oust of CEO Jensen Huang has slightly diminished the safe-haven appeal of the US Dollar. The company has reported that its revenue from data centres, a significant part of Nvidia's business, has doubled to $107 billion in the quarter ending September.
Regarding the outlook of Nvidia’s business amid the resignation of CEO Huang, interim CEO Colette Kress has said in a call with analysts that “business is usual”, adding, "Our momentum is real. Our demand is accelerating. Our supply is growing. Our customers and our partners are with us, and employees are committed," BBC reported.
The recent upside run up in the US Dollar was partially supported by heightened concerns in the Artificial Intelligence (AI) infrastructure demand, following the victory of Democrats in United States (US) midterm elections and the exit of Jensen Huang.
Analysts at ING said before Nvidia results that “the sell-off has spilled over sufficiently into broader US and global equities for the Dollar to benefit from its safe-haven role”.
On the monetary policy front, investors await Federal Open Market Committee (FOMC) minutes of the October meeting, which will be published later in the day. In the last meeting, the Fed left interest rates steady in the 3.75%-4.00%, but categorized it as pause and not an end to the monetary tightening cycle.
US Dollar Index Technical Analysis
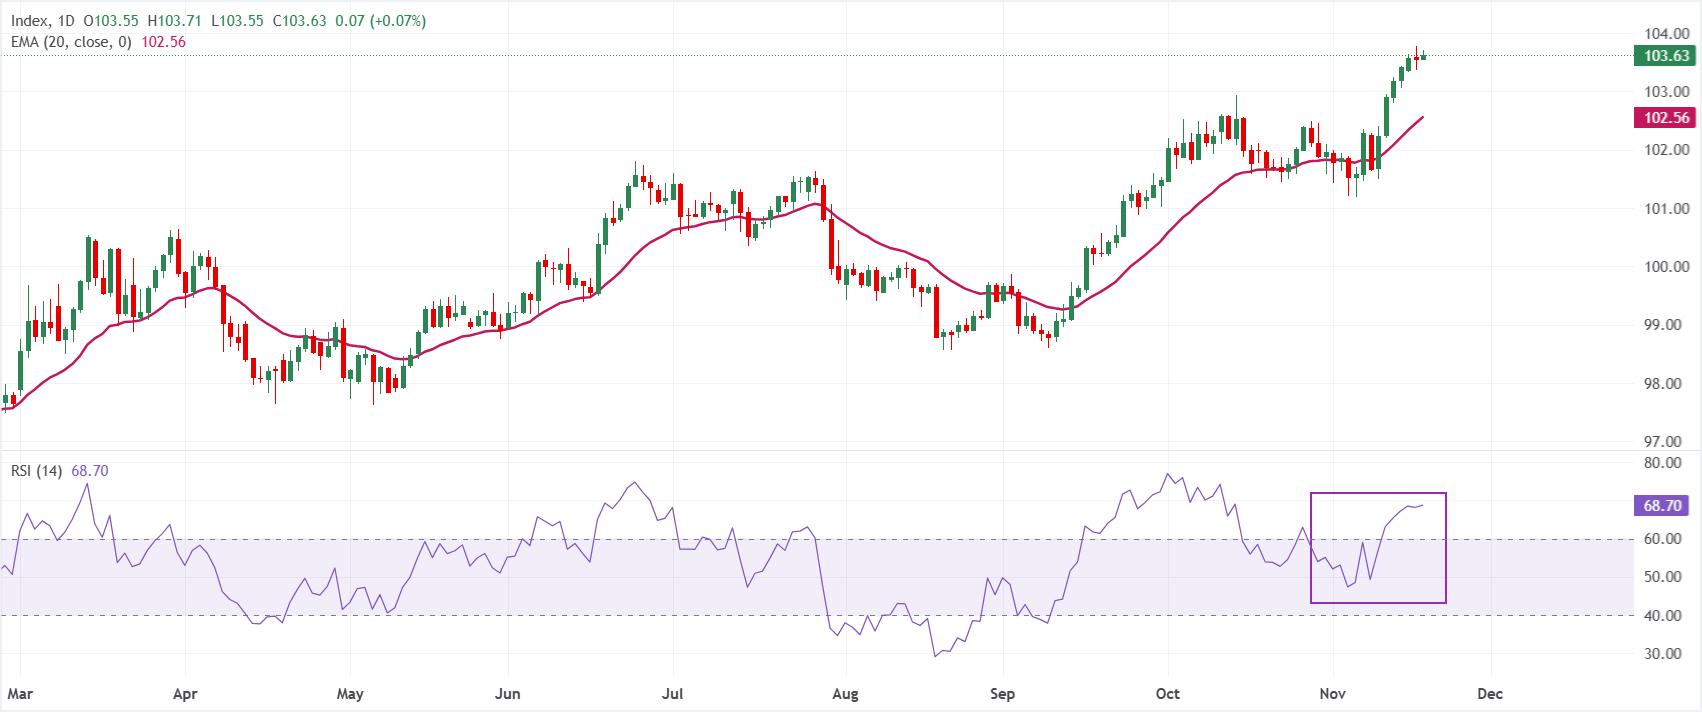
In the daily chart, Dollar Index Spot trades at 103.63, maintaining a bullish near-term bias as it holds well above the 20-day exponential moving average (EMA) at 102.56. Price action remains underpinned by this rising short-term EMA, while the Relative Strength Index (RSI) at 68.70 hovers just below overbought territory, suggesting strong but stretched upside momentum that could slow rather than immediately reverse the advance.
On the downside, initial support is provided by the 20-day EMA around 102.56, where a pullback would be expected to attract dip-buying interest while this level holds. A daily close below this dynamic support would hint at a deeper corrective phase, but as long as the index sustains levels above 102.56, the technical structure favors further gains after any consolidation.
(The technical analysis of this story was written with the help of an AI tool. Know more.)
US Dollar FAQs
The US Dollar (USD) is the official currency of the United States of America, and the ‘de facto’ currency of a significant number of other countries where it is found in circulation alongside local notes. It is the most heavily traded currency in the world, accounting for over 88% of all global foreign exchange turnover, or an average of $6.6 trillion in transactions per day, according to data from 2022. Following the second world war, the USD took over from the British Pound as the world’s reserve currency. For most of its history, the US Dollar was backed by Gold, until the Bretton Woods Agreement in 1971 when the Gold Standard went away.
The most important single factor impacting on the value of the US Dollar is monetary policy, which is shaped by the Federal Reserve (Fed). The Fed has two mandates: to achieve price stability (control inflation) and foster full employment. Its primary tool to achieve these two goals is by adjusting interest rates. When prices are rising too quickly and inflation is above the Fed’s 2% target, the Fed will raise rates, which helps the USD value. When inflation falls below 2% or the Unemployment Rate is too high, the Fed may lower interest rates, which weighs on the Greenback.
In extreme situations, the Federal Reserve can also print more Dollars and enact quantitative easing (QE). QE is the process by which the Fed substantially increases the flow of credit in a stuck financial system. It is a non-standard policy measure used when credit has dried up because banks will not lend to each other (out of the fear of counterparty default). It is a last resort when simply lowering interest rates is unlikely to achieve the necessary result. It was the Fed’s weapon of choice to combat the credit crunch that occurred during the Great Financial Crisis in 2008. It involves the Fed printing more Dollars and using them to buy US government bonds predominantly from financial institutions. QE usually leads to a weaker US Dollar.
Quantitative tightening (QT) is the reverse process whereby the Federal Reserve stops buying bonds from financial institutions and does not reinvest the principal from the bonds it holds maturing in new purchases. It is usually positive for the US Dollar.
Recommended Articles


