

Chainlink Price Forecast: LINK holds key support as ETF outflows, bearish bias persist

Source Fxstreet
  • Chainlink hovers above $9 on Wednesday, maintaining a crucial support level after last week’s 10% decline.
  • LINK-focused ETFs recorded their third consecutive day of outflows, with $1.33 million withdrawn on Tuesday.
  • The technical outlook for LINK is mixed as persistent downside momentum approaches oversold conditions.

Chainlink (LINK) shows a relief attempt above $9.00 on Wednesday, defending a crucial support level near $8.60 after last week’s 10% losses. LINK-focused Exchange Traded Funds (ETFs) continue to face selling pressure from institutional investors, recording over $2 million in outflows so far this week amid mixed signals from the derivatives market. Chainlink could extend its decline toward the $7.00 round figure if selling pressure persists.

LINK ETF outflows extend for the fourth week

Institutional investors continue to reduce their exposure to LINK for the fourth straight week. SoSoValue data shows LINK ETFs mirrored Monday’s $1.33 million in outflows on Tuesday, extending the previous week’s outflow of $705,590. 

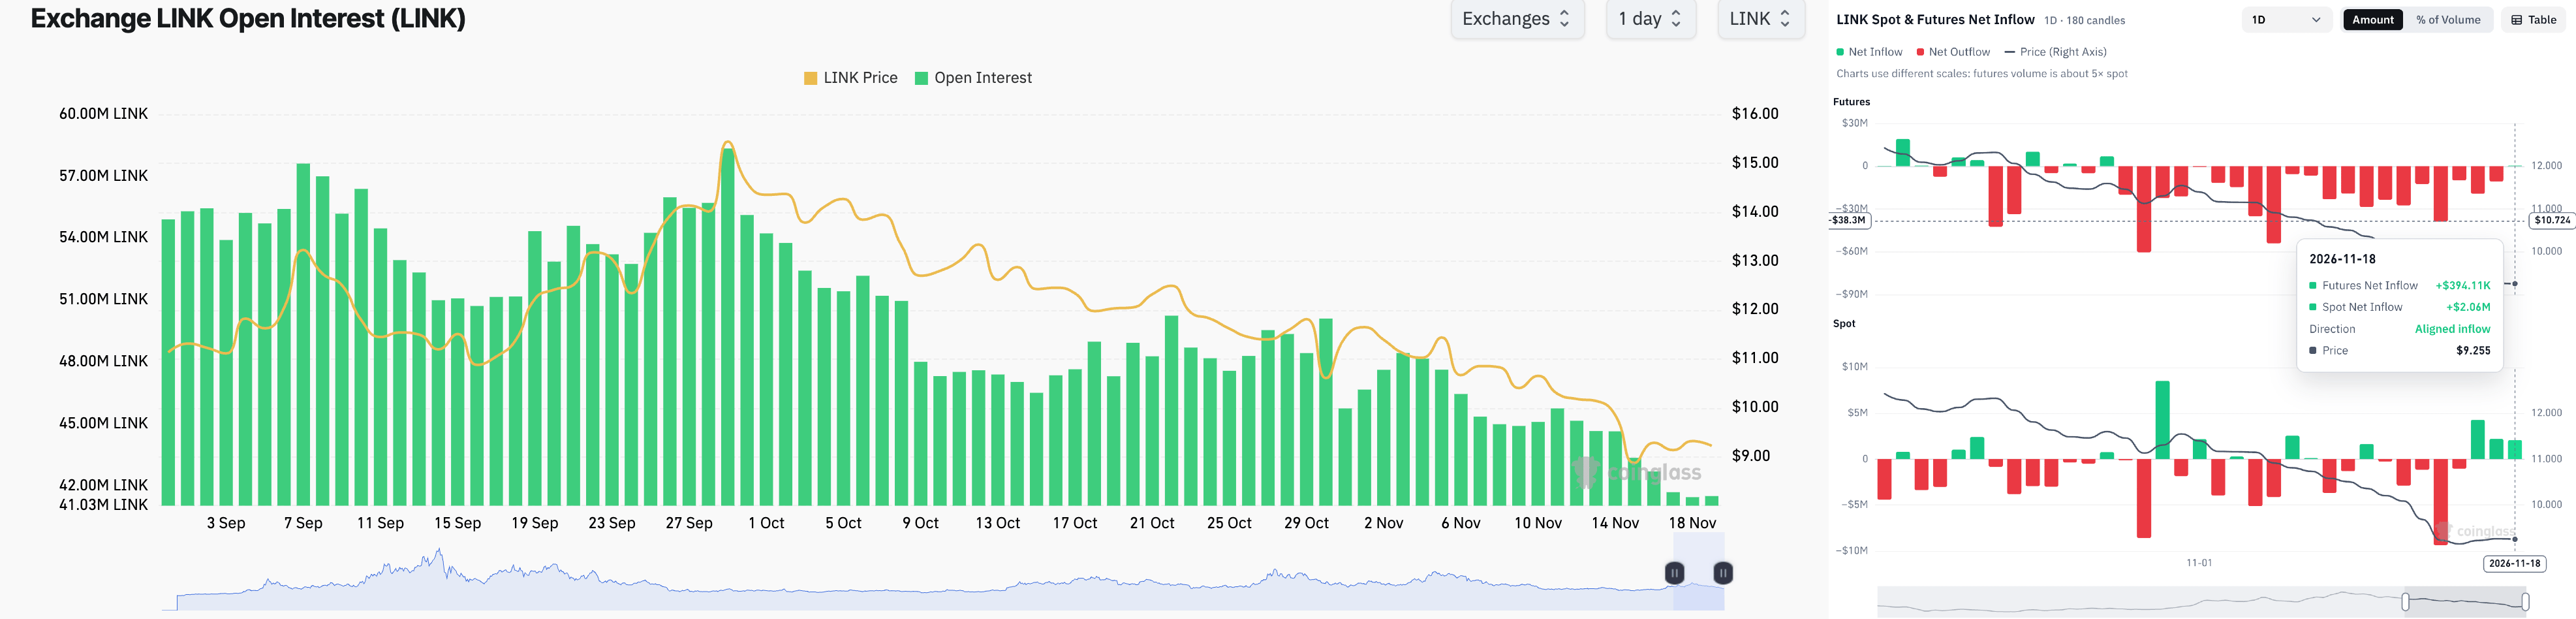
On the derivatives side, CoinGlass data shows the Chainlink futures Open Interest (OI) is down to 41.50 million LINK, from 45.75 million LINK last week, indicating a positional wipeout. Meanwhile, the futures and spot net inflows are at $394,110 and $2.06 million so far on Wednesday, hinting at potential capital inflows that could support its near-term recovery.
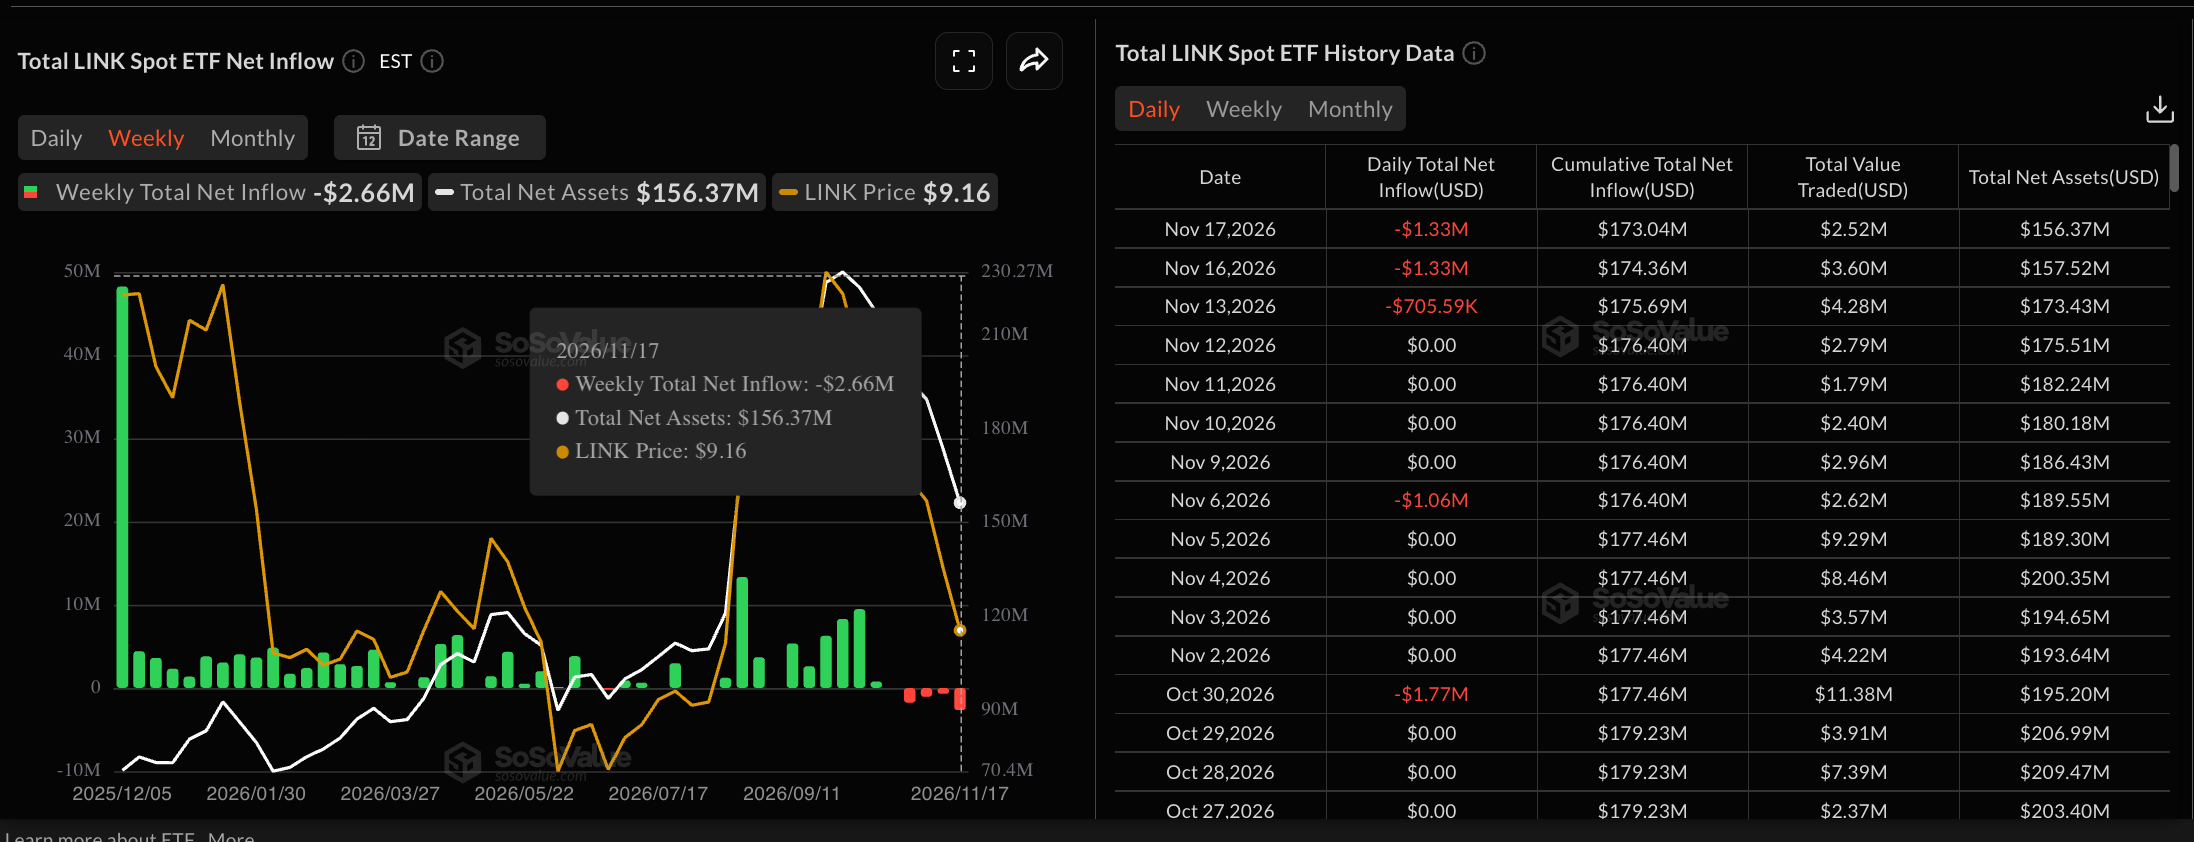
LINK ETFs data. Source: Sosovalue
LINK derivatives data. Source: CoinGlass

Technical outlook: Will LINK’s recovery reclaim $10?

Chainlink trades at $9.26 at press time on Wednesday, holding a bearish near-term bias well below the 200-day and 50-day Exponential Moving Averages (EMAs) at $10.89 and $11.09, respectively. This configuration suggests rallies are likely to be capped while the pair trades under this dense overhead band.

The Moving Average Convergence Divergence (MACD) line edges higher in negative territory, and the Relative Strength Index (RSI) stabilizes just above the oversold level of 34, hinting at slowing downside momentum rather than a confirmed reversal.

On the topside, initial resistance is seen at the horizontal barrier around $10.87, followed closely by the 200-day EMA at $10.89 and the 50-day EMA at $11.09, forming a critical confluence zone that bulls would need to reclaim to ease the broader bearish pressure, ahead of higher hurdles at $12.40 and $15.53.

Chart Analysis LINK/USDT (Binance)
LINK/USDT daily price chart.

Looking down, immediate support emerges at $8.60, with a deeper floor near $7.01, where buyers would be expected to show stronger interest if selling resumes.

(The technical analysis of this story was written with the help of an AI tool. Know more.)

Disclaimer: For information purposes only. Past performance is not indicative of future results.
placeholder
Anthropic is six times oversubscribed at $1.4 trillion while Nvidia is down 32% — the AI trade has two pricesAnthropic lists on Nasdaq as ANT on Thursday at $70 ~ $78 a share, raising up to $64.4 billion at a target valuation near $1.4 trillion, and the book is reportedly six times covered. In the same six weeks, Nvidia has fallen 32% and the QQQ is 10.9% below its October peak. Private capital and public markets are marking the same AI complex at two very different prices. This piece separates the two books: what the S-1 shows, who is anchoring the $26 billion private placement, and what Thursday's debut would have to do to change the public tape.
Author  Irene Q.
Nov 16, Mon
Anthropic lists on Nasdaq as ANT on Thursday at $70 ~ $78 a share, raising up to $64.4 billion at a target valuation near $1.4 trillion, and the book is reportedly six times covered. In the same six weeks, Nvidia has fallen 32% and the QQQ is 10.9% below its October peak. Private capital and public markets are marking the same AI complex at two very different prices. This piece separates the two books: what the S-1 shows, who is anchoring the $26 billion private placement, and what Thursday's debut would have to do to change the public tape.
placeholder
Gold Price Analysis Today | Forex Gold Analysis | XAU/USD Analysis - November 16, 2026Get the latest gold price analysis, forex gold insights, and XAU/USD analysis for November 16, 2026. Read on for the details.
Author  Mitrade
Nov 16, Mon
Get the latest gold price analysis, forex gold insights, and XAU/USD analysis for November 16, 2026. Read on for the details.
placeholder
Weekly Report: DXY 103.41, 10-year 5.15%, AUD carry 3bp — three FX regimes flipped in one weekThe dollar index rose 1.09% to 103.41, a 19-month high, while the US 10-year closed at 5.154% and the Australia-US two-year spread collapsed to about 3 basis points from 36. EURUSD fell 1.59% to 1.1024, USDJPY rose 1.51% to 159.78 and AUDUSD fell 1.79% to 0.6764, a 10-month low. Three FX regimes — the broad dollar, the US rate level and the Australian carry premium — flipped in the same week. This report marks the thresholds, ranks which one can flip back first, and lists the week's calendar.
Author  Irene Q.
Nov 16, Mon
The dollar index rose 1.09% to 103.41, a 19-month high, while the US 10-year closed at 5.154% and the Australia-US two-year spread collapsed to about 3 basis points from 36. EURUSD fell 1.59% to 1.1024, USDJPY rose 1.51% to 159.78 and AUDUSD fell 1.79% to 0.6764, a 10-month low. Three FX regimes — the broad dollar, the US rate level and the Australian carry premium — flipped in the same week. This report marks the thresholds, ranks which one can flip back first, and lists the week's calendar.
placeholder
Gold Price Analysis Today | Forex Gold Analysis | XAU/USD Analysis - November 17, 2026Get the latest gold price analysis, forex gold insights, and XAU/USD analysis for November 17, 2026. Read on for the details.
Author  Mitrade
Yesterday 05: 40
Get the latest gold price analysis, forex gold insights, and XAU/USD analysis for November 17, 2026. Read on for the details.
placeholder
Gold Price Analysis Today | Forex Gold Analysis | XAU/USD Analysis - November 18, 2026Get the latest gold price analysis, forex gold insights, and XAU/USD analysis for November 18, 2026. Read on for the details.
Author  Mitrade
7 hours ago
Get the latest gold price analysis, forex gold insights, and XAU/USD analysis for November 18, 2026. Read on for the details.
Related Instrument
goTop
quote