


USD/CAD Price Forecast; Dollar picks up above 1.4000 as Oil prices hit the CAD
- USD/CAD returns above 1.4000 after bouncing from five-month lows near 1.3960 on Friday.
- The US Dollar trims losses ahead of the Fed's decision, while lower oil prices are weighing on the CAD.
- The pair is showing initial signs of bottoming after depreciating 2% over the previous two weeks.
The US Dollar (USD) is trimming some losses against the Canadian Dollar (CAD) on Monday as investors brace for the US Federal Reserve (Fed) monetary policy decision, due on Wednesday, while lower Oil prices hurt the commodity-sensitive Loonie. The USD/CAD pair is trading at 1.4023 after bouncing from Friday’s lows at 1.3968 lows on Friday although the broader trend remains bearish, after a nearly 2% selloff over the previous two weeks.
The Greenback is trading higher against its main peers in a calm session on Monday, as investors shift their focus back to the Fed's monetary policy decision. The bank is widely expected to leave rates on hold after having hiked them in September, but the high inflation risks have fuelled expectations of a second quarter-point hike in December.
Beyond that, Oil prices have dropped about 2% from Friday’s highs, increasing pressure on the Loonie. The barrel of Brent Oil trades around $110.30 as of writing, down from Friday’s highs near $ 113.00. News that Qatari negotiators have arrived in Tehran to try to de-escalate the conflict with the US has been welcomed by the market, while US President Trump has discarded any new attacks on Iran before the mid-term elections, which contributed to easing pressure on prices.
Technical Analysis: Friday's "Hammer" candle hints at a potential bullish reversal
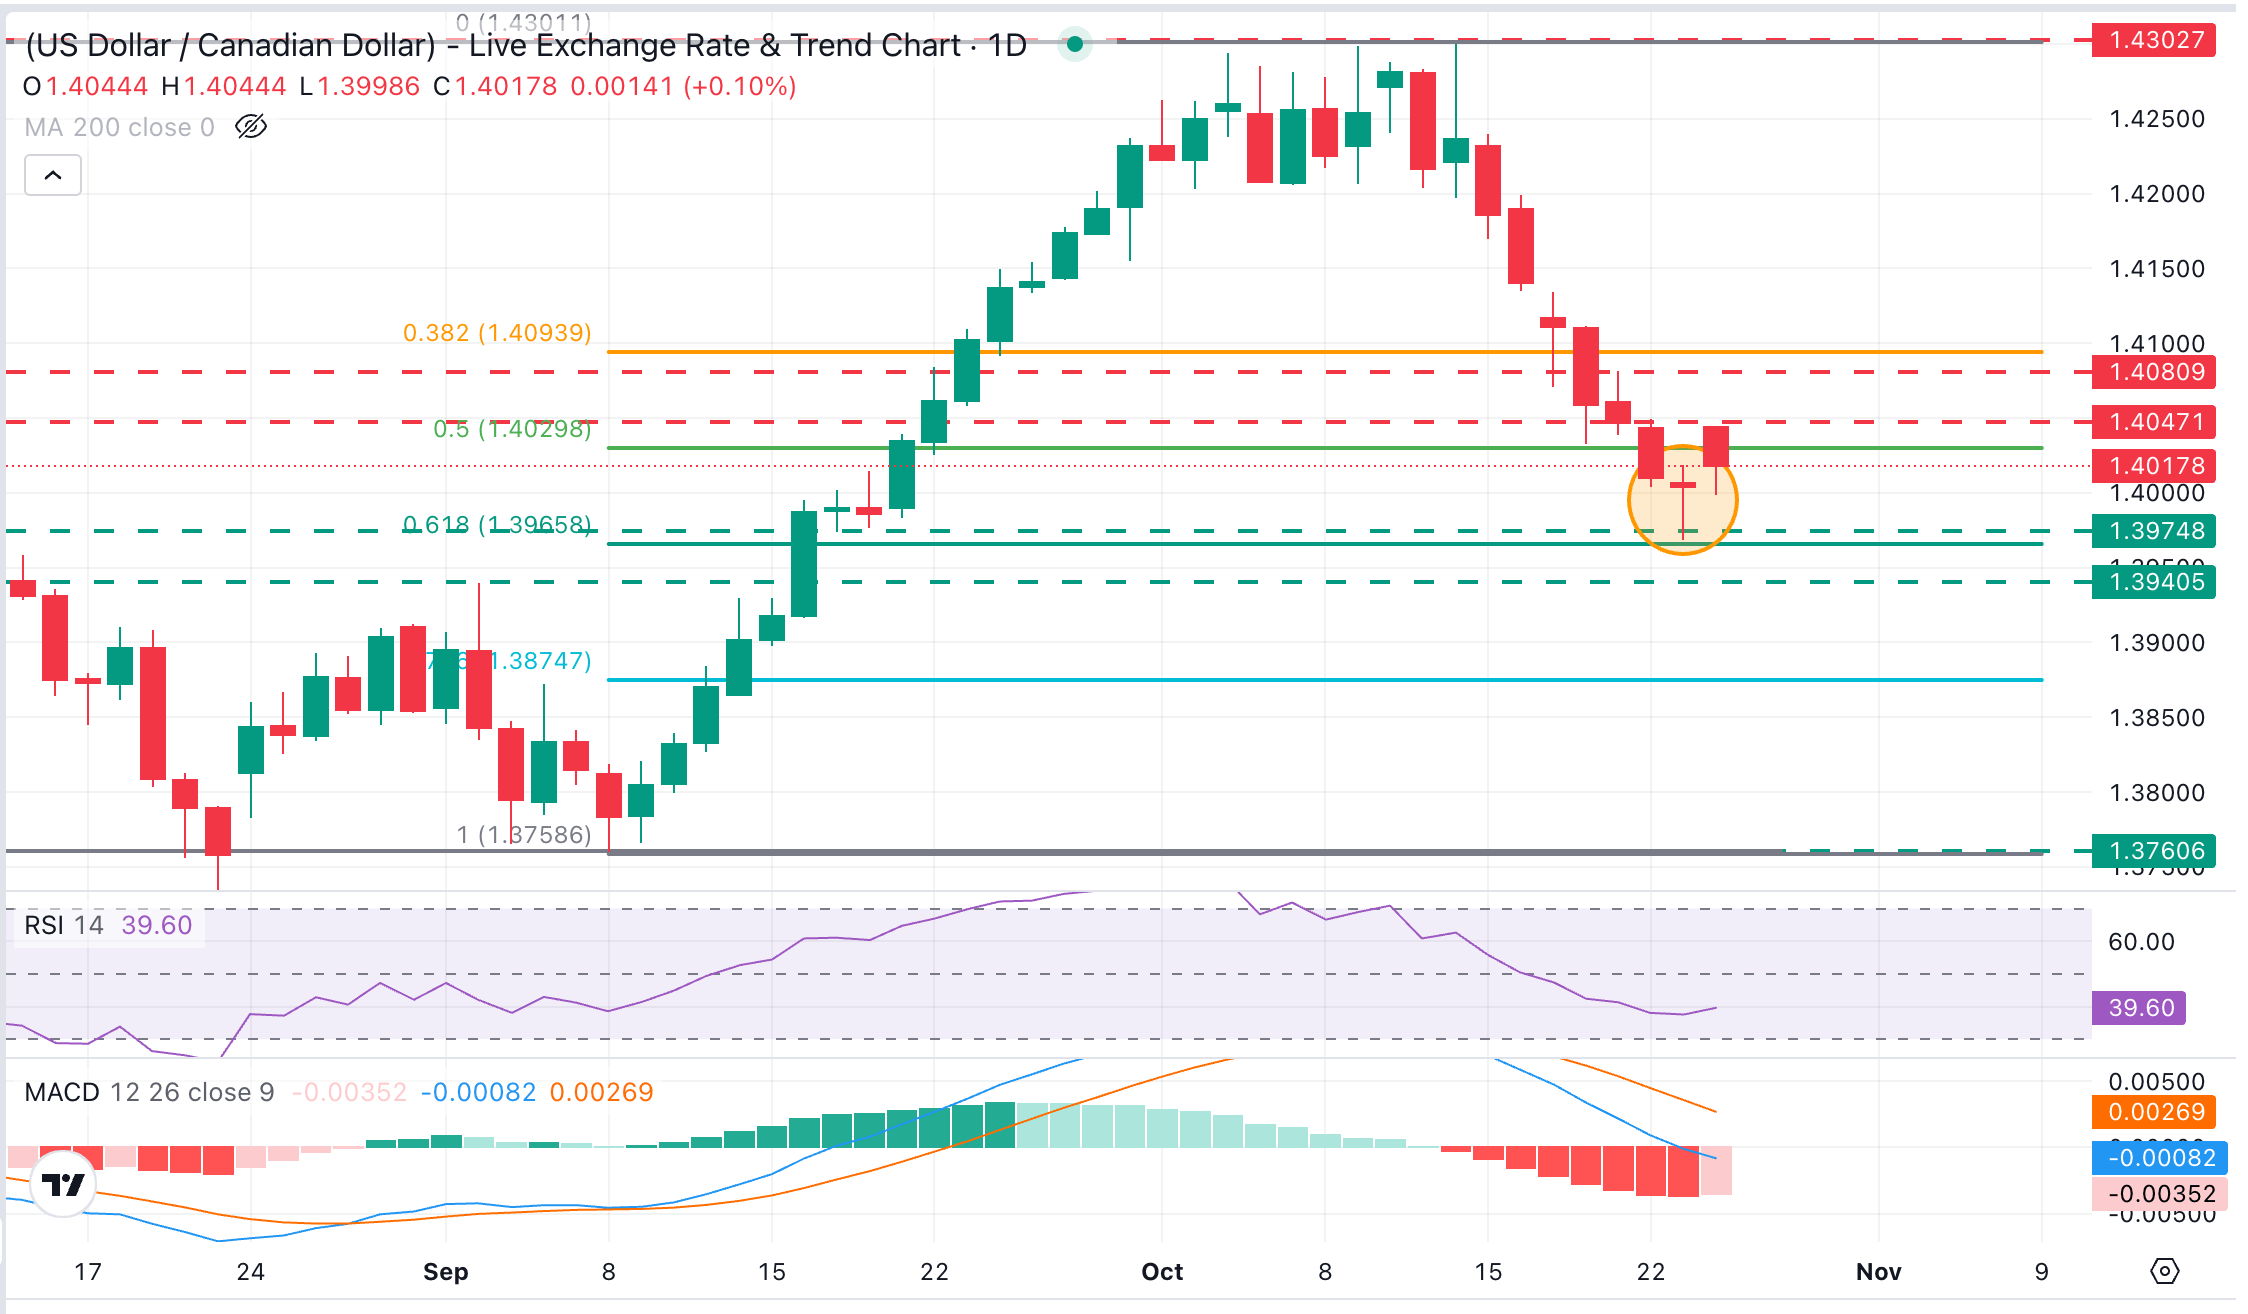
USD/CAD trades at 1.4018, with the pair showing a capped tone, yet with recent price action showing a "hammer" candle on Friday, a figure often anticipating a bullish reversal. Momentum indicators in the daily chart, however, are still at negative levels. The Relative Strength Index (14) remains below 40, with the Moving Average Convergence Divergence (MACD) well within negative territory, altogether reinforcing the idea that rallies could struggle.
Bulls remain capped below Thursday's high, at the 1.4040 area, which closes the path towards the October 19 low and October 21 high in the 1.4080 area.
On the downside, initial support is clustered around the September 17 and 18 lows in the 1.3975 area and the 61.8% Fibonacci retracement of the September - October rally, at 1.3965. Further down, the September 2 high, near 1.3940, and the 78.2% Fibonacci retracement, at 1.3874, would come into focus.
(The technical analysis of this story was written with the help of an AI tool. Know more.)
Canadian Dollar Price Today
The table below shows the percentage change of Canadian Dollar (CAD) against listed major currencies today. Canadian Dollar was the strongest against the Japanese Yen.
| USD | EUR | GBP | JPY | CAD | AUD | NZD | CHF | |
|---|---|---|---|---|---|---|---|---|
| USD | 0.12% | 0.19% | 0.43% | 0.10% | 0.17% | 0.35% | 0.20% | |
| EUR | -0.12% | 0.11% | 0.26% | -0.03% | 0.05% | 0.25% | 0.09% | |
| GBP | -0.19% | -0.11% | 0.17% | -0.12% | -0.06% | 0.14% | -0.02% | |
| JPY | -0.43% | -0.26% | -0.17% | -0.29% | -0.25% | -0.05% | -0.21% | |
| CAD | -0.10% | 0.03% | 0.12% | 0.29% | 0.04% | 0.26% | 0.10% | |
| AUD | -0.17% | -0.05% | 0.06% | 0.25% | -0.04% | 0.21% | 0.03% | |
| NZD | -0.35% | -0.25% | -0.14% | 0.05% | -0.26% | -0.21% | -0.15% | |
| CHF | -0.20% | -0.09% | 0.02% | 0.21% | -0.10% | -0.03% | 0.15% |
The heat map shows percentage changes of major currencies against each other. The base currency is picked from the left column, while the quote currency is picked from the top row. For example, if you pick the Canadian Dollar from the left column and move along the horizontal line to the US Dollar, the percentage change displayed in the box will represent CAD (base)/USD (quote).
Recommended Articles


