


USD/CHF Price Forecast: Dollar regains some momentum and approaches 0.8250
- USD/CHF hits session highs near 0.8250 after bouncing from one-month lows below 0.8200.
- Moderate risk aversion buoys the Greenback as Oil hits fresh five-month highs.
- French yields have pulled back from highs, easing the attractiveness of the CHF as a safe haven.
The US Dollar (USD) is trimming losses against the Swiss Franc (CHF) on Friday, as the risk-off mood, stemming from surging Oil prices, has offset the negative impact of falling US Treasury yields. The USD/CHF bounces up from the support area around 0.8200 and is testing Thursday's highs at 0.8247 at the time of writing, with momentum indicators showing fading bearish traction.
Brent Oil prices have rallied to fresh five-month highs above $110.00 on Friday, as Iran's tighter grip on the Strait of Hormuz and fresh attacks on Saudi Arabian oilfields have resurfaced fears about supply concerns. Crude at these prices adds strain to Oil-importing economies such as Switzerland's.
Beyond that, the yield of the French 10-year OAT bond retreated 10 basis points from the multi-decade high, at 5.14%, reached on Thursday. This has eased the speculative appeal of the CHF, which has been acting as a haven amid France’s debt crisis,
Technical Analysis: US Dollar finds buyers at the 0.8200 support area
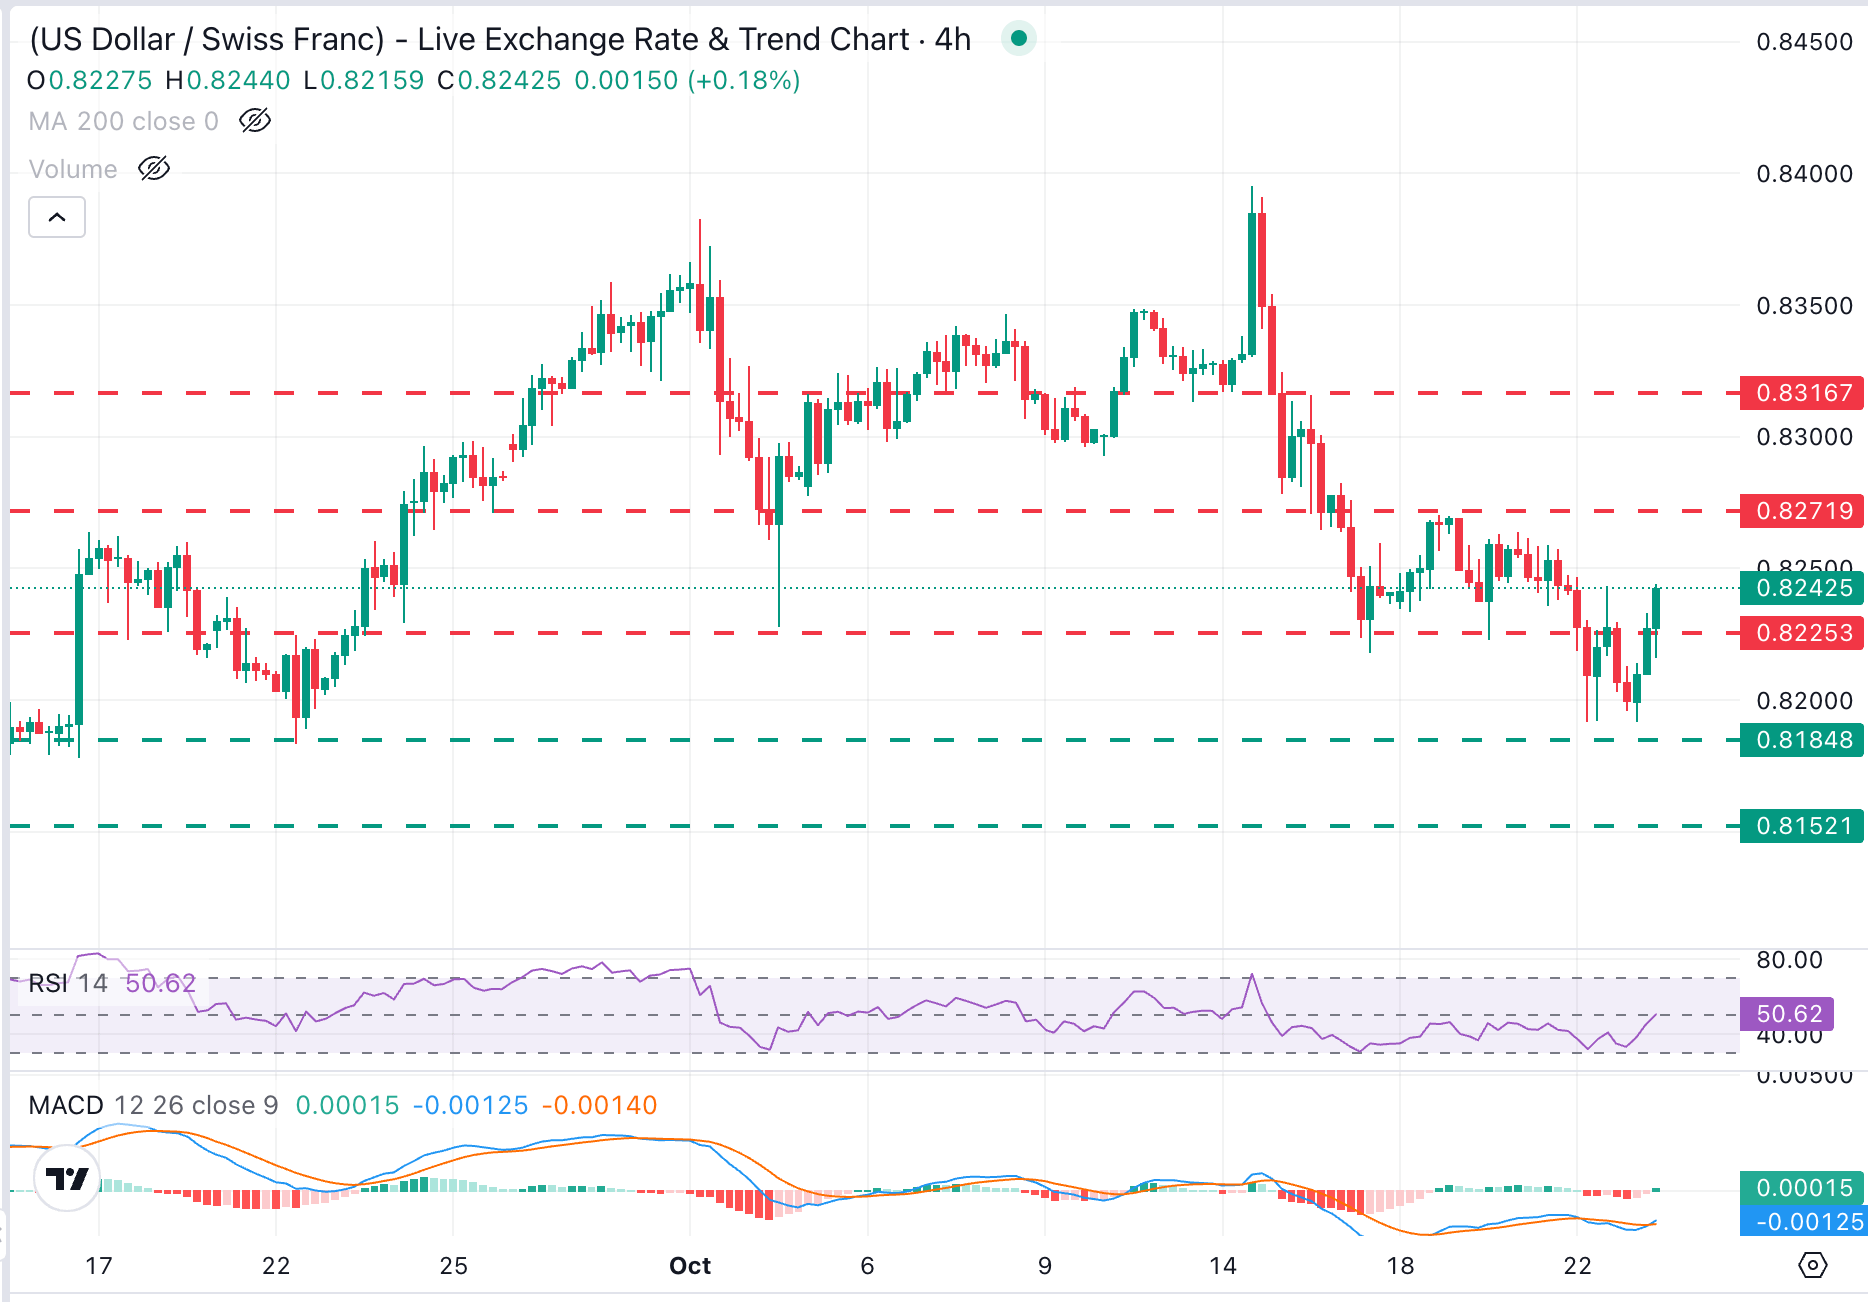
USD/CHF trades at 0.8242, keeping a modest bullish near-term bias as the recovery from 0.8200 area extends beyond a previous support level at 0.8230. Momentum indicators show fading bearish traction, with the 4-hour Relative Strength Index (14) returning to the neutral 50 area, and the Moving Average Convergence Divergence (MACD) turning positive.
If bulls manage to consolidate above 0.8230, the focus would shift to the weekly highs in the area of 0.8275. A clear break of that level cancels the bearish trend and brings the October 13 and 14 lows, around 0.8315, into play.
A reversal below 0.8230, on the contrary, would lure bears to retest support around the 0.8185 area (September 22 low). Further down, the next target is the mid-August and ealy September top, in the 0.8150 area.
(The technical analysis of this story was written with the help of an AI tool. Know more.)
US Dollar Price Today
The table below shows the percentage change of US Dollar (USD) against listed major currencies today. US Dollar was the strongest against the Swiss Franc.
| USD | EUR | GBP | JPY | CAD | AUD | NZD | CHF | |
|---|---|---|---|---|---|---|---|---|
| USD | 0.19% | 0.21% | 0.08% | -0.05% | 0.03% | -0.03% | 0.45% | |
| EUR | -0.19% | 0.02% | -0.11% | -0.23% | -0.19% | -0.22% | 0.25% | |
| GBP | -0.21% | -0.02% | -0.15% | -0.25% | -0.20% | -0.23% | 0.24% | |
| JPY | -0.08% | 0.11% | 0.15% | -0.13% | -0.06% | -0.11% | 0.38% | |
| CAD | 0.05% | 0.23% | 0.25% | 0.13% | 0.09% | 0.00% | 0.51% | |
| AUD | -0.03% | 0.19% | 0.20% | 0.06% | -0.09% | -0.05% | 0.42% | |
| NZD | 0.03% | 0.22% | 0.23% | 0.11% | -0.00% | 0.05% | 0.48% | |
| CHF | -0.45% | -0.25% | -0.24% | -0.38% | -0.51% | -0.42% | -0.48% |
The heat map shows percentage changes of major currencies against each other. The base currency is picked from the left column, while the quote currency is picked from the top row. For example, if you pick the US Dollar from the left column and move along the horizontal line to the Japanese Yen, the percentage change displayed in the box will represent USD (base)/JPY (quote).
Recommended Articles


