


Yen gains as Trump rules out Iran strikes before the midterms
- USD/JPY dipped through its 200-day average to 157.50 on Trump's Iran pledge.
- The 10-year Treasury yield fell back from its highest level since 2002.
The 10-year Treasury yield ended near 5.22% after President Trump said on Truth Social that the US won't attack Iran before the midterm elections. It had touched its highest since 2002 on Wednesday.
Trump called the talks with Tehran productive and kept the US blockade in place, and Brent fell within minutes on a promise that runs out on November 3. Cheaper oil could mean less US inflation and fewer reasons for Fed hikes.
USD/JPY moves with the gap between US and Japanese rates, because that gap is the extra income from borrowing Yen to hold Dollars. The Fed's rate, 3.75%-4.00%, is 2.50-2.75 percentage points above the 1.25% set by the Bank of Japan (BoJ), and lower US yields shrink that income.
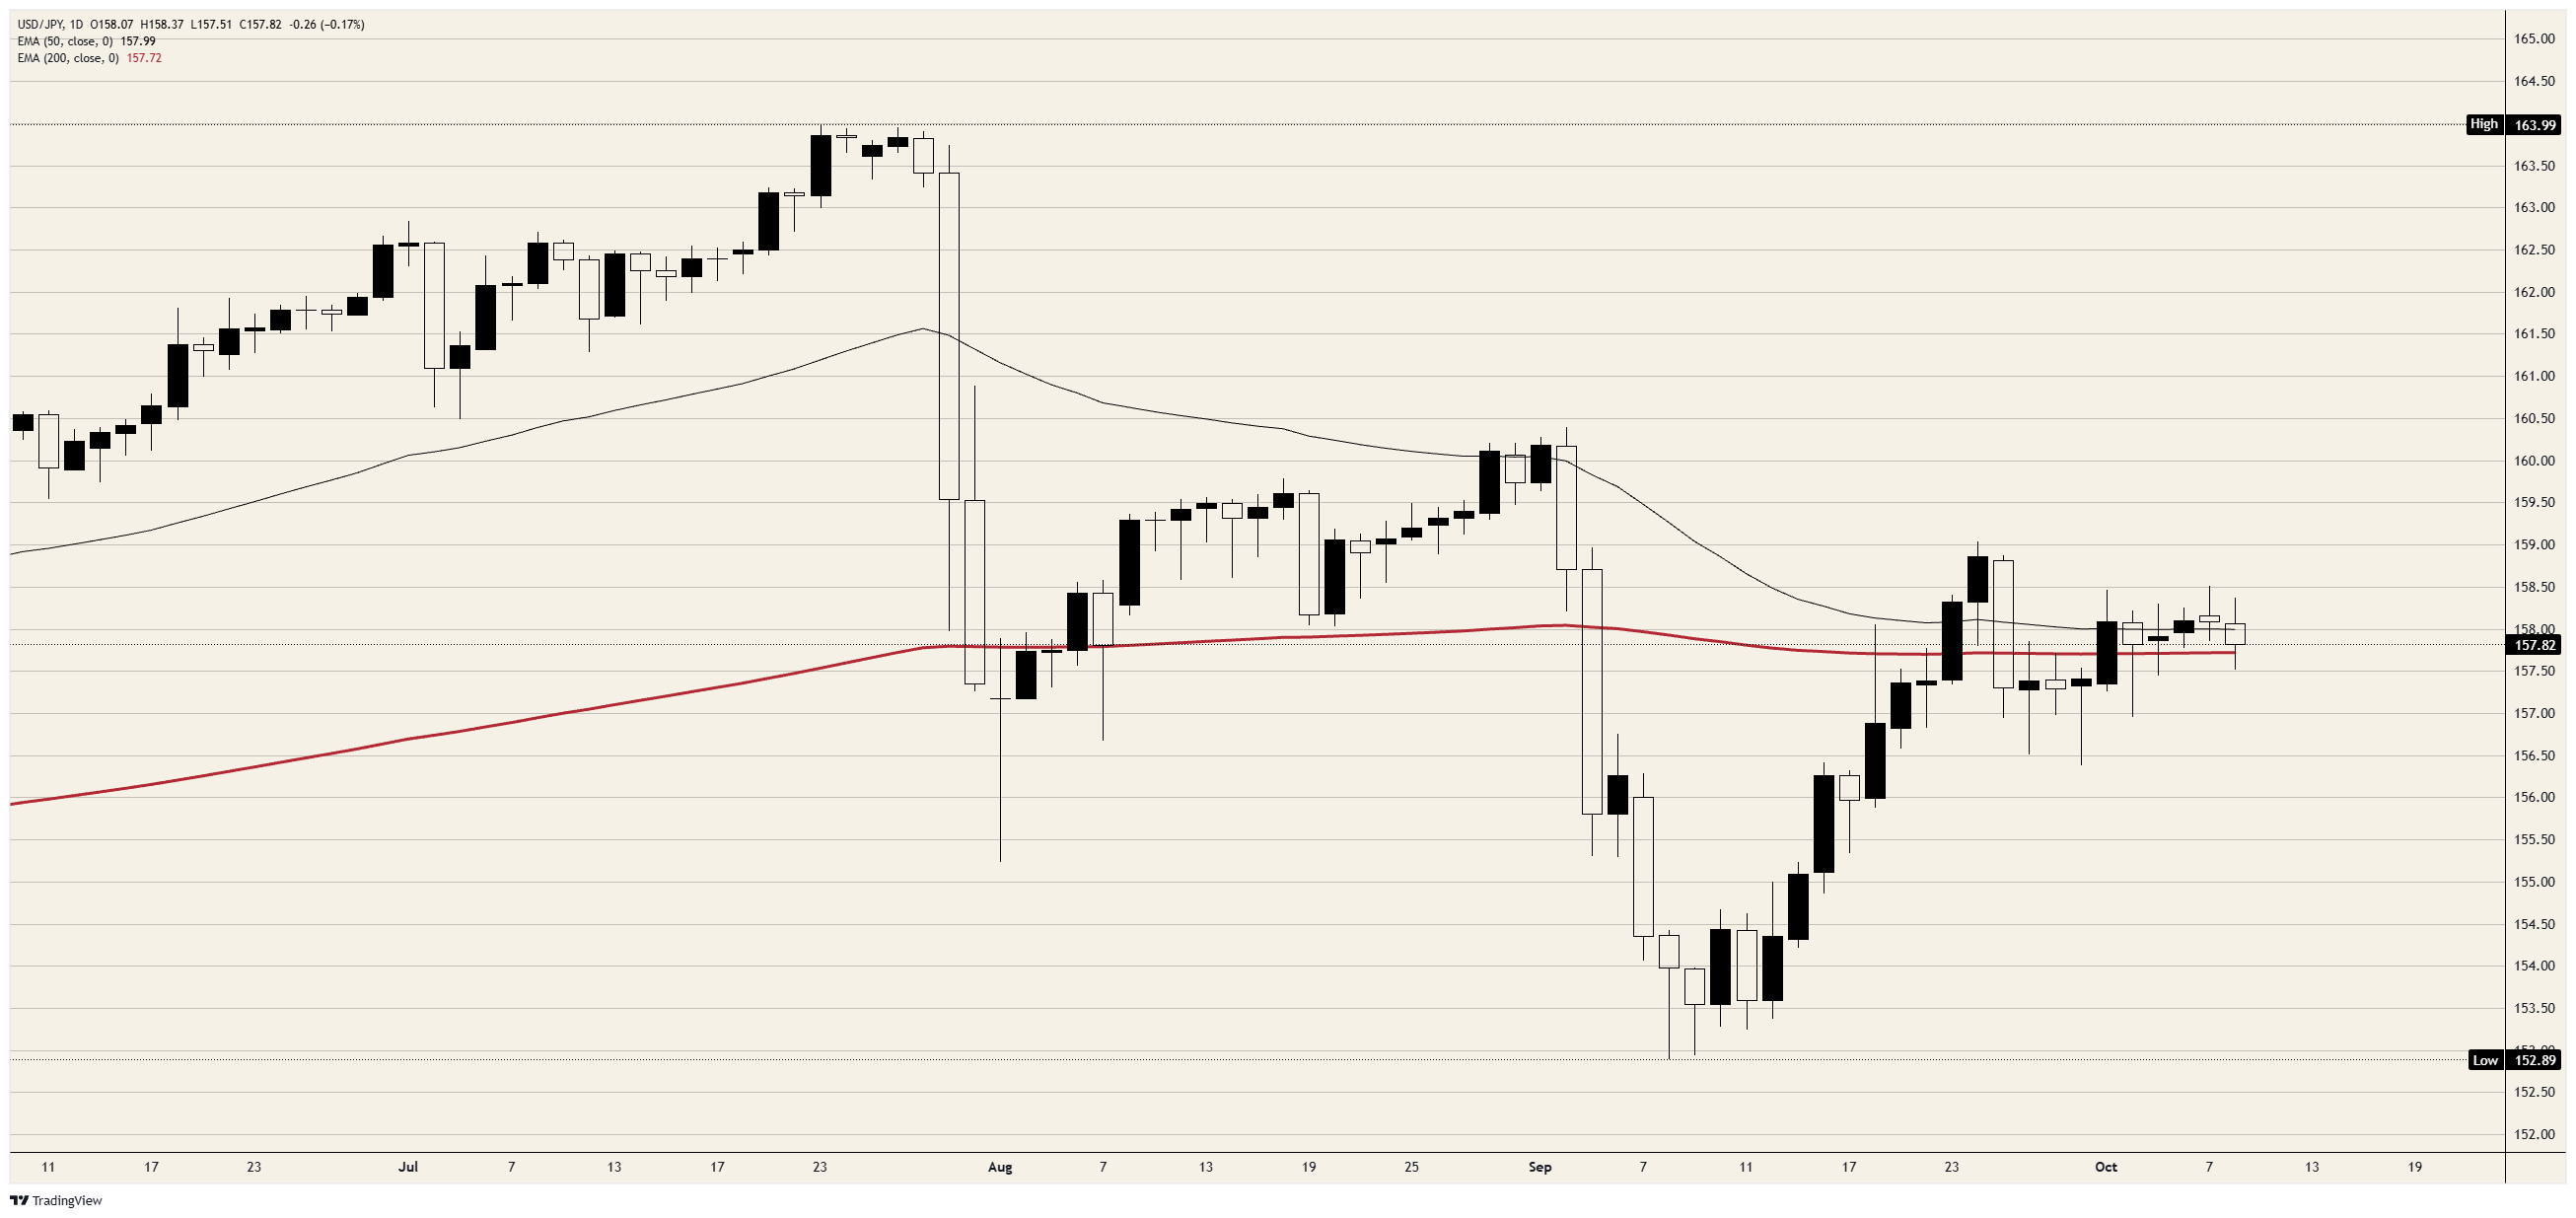
Two dips came close to 157.50 on Thursday, the first on talk of Japanese intervention and the second in the bars after the statement, and both stopped above Monday's low. The second came from a high just under 158.50, below Wednesday's, and fell through the 200-day Exponential Moving Average (EMA) just above 157.50.
St. Louis Fed President Musalem then said in New York that rates should rise over the next six to nine months, and USD/JPY recovered about a third of the drop. It closed just under 158.00, between the 200-day EMA and the 50-day EMA, and every close since October 1 has been within about 20 pips of 158.00.
Friday's University of Michigan (UoM) sentiment index is forecast to slip to 47.6 from 48.1, but the bigger test for US yields comes on Wednesday, October 14. US Consumer Price Index (CPI) inflation was 3.4% in August against 2.4% with food and energy stripped out, so those two categories add a full point to the headline rate and oil reaches both.
Retail sales and producer prices follow on Thursday, October 15, the same day BoJ board member Koeda speaks.
A firm core reading could add to Fed hike bets and send USD/JPY back toward the September 24 high near 159.00, while a soft one may keep its closes clustered near 158.00.
USD/JPY daily chart
Japanese Yen FAQs
The Japanese Yen (JPY) is one of the world’s most traded currencies. Its value is broadly determined by the performance of the Japanese economy, but more specifically by the Bank of Japan’s policy, the differential between Japanese and US bond yields, or risk sentiment among traders, among other factors.
One of the Bank of Japan’s mandates is currency control, so its moves are key for the Yen. The BoJ has directly intervened in currency markets sometimes, generally to lower the value of the Yen, although it refrains from doing it often due to political concerns of its main trading partners. The BoJ ultra-loose monetary policy between 2013 and 2024 caused the Yen to depreciate against its main currency peers due to an increasing policy divergence between the Bank of Japan and other main central banks. More recently, the gradually unwinding of this ultra-loose policy has given some support to the Yen.
Over the last decade, the BoJ’s stance of sticking to ultra-loose monetary policy has led to a widening policy divergence with other central banks, particularly with the US Federal Reserve. This supported a widening of the differential between the 10-year US and Japanese bonds, which favored the US Dollar against the Japanese Yen. The BoJ decision in 2024 to gradually abandon the ultra-loose policy, coupled with interest-rate cuts in other major central banks, is narrowing this differential.
The Japanese Yen is often seen as a safe-haven investment. This means that in times of market stress, investors are more likely to put their money in the Japanese currency due to its supposed reliability and stability. Turbulent times are likely to strengthen the Yen’s value against other currencies seen as more risky to invest in.
Recommended Articles


