

GBP/JPY Price Forecast: Struggles at 209.00 as bearish-engulfing looms

Source Fxstreet
  • GBP/JPY holds near 208.87 after rejecting the 209.40 high.
  • RSI stays bearish near 43, signaling limited bullish momentum.
  • Break below 208.20 exposes 208.00 and September low at 206.89.

The GBP/JPY seesaws on Thursday, poised to end the session unchanged at 208.87, after prices traveled from the low of the day (LOD) of 208.20, towards a daily high of 209.40, before settling at around current levels.

GBP/JPY Price Forecast: Technical outlook

Price action shows the GBP/JPY cross is still bearish, after diving over 4.46% following a coordinated two-day intervention between the US and Japan, with sellers pushing prices towards a yearly low of 207.10, hit on September 8.

Since then, the cross has recovered some ground but has remained within familiar levels. During the day, it hit an eight-day high of 210.20 on October 7 before retreating beneath 209.00.

The Relative Strength Index (RSI), although bearish, is flat near 43, suggesting that further consolidation lies ahead. Nonetheless, in the short term, the crossover of the 50-day Simple Moving Average (SMA) below the 200-day SMA indicates that bears are in control.

For a bearish resumption, sellers must clear the October 8 low of 208.20 before testing the 208.00 figure. On further weakness, the next support is the September 30 low of 206.89.

Should buyers push prices above 209.50, a test of 210.00 is on the cards. Above this level, the traders' target would be the September 18 high at 211.28, followed by the 50-day SMA at 211.98.

GBP/JPY Price Chart – Technical outlook
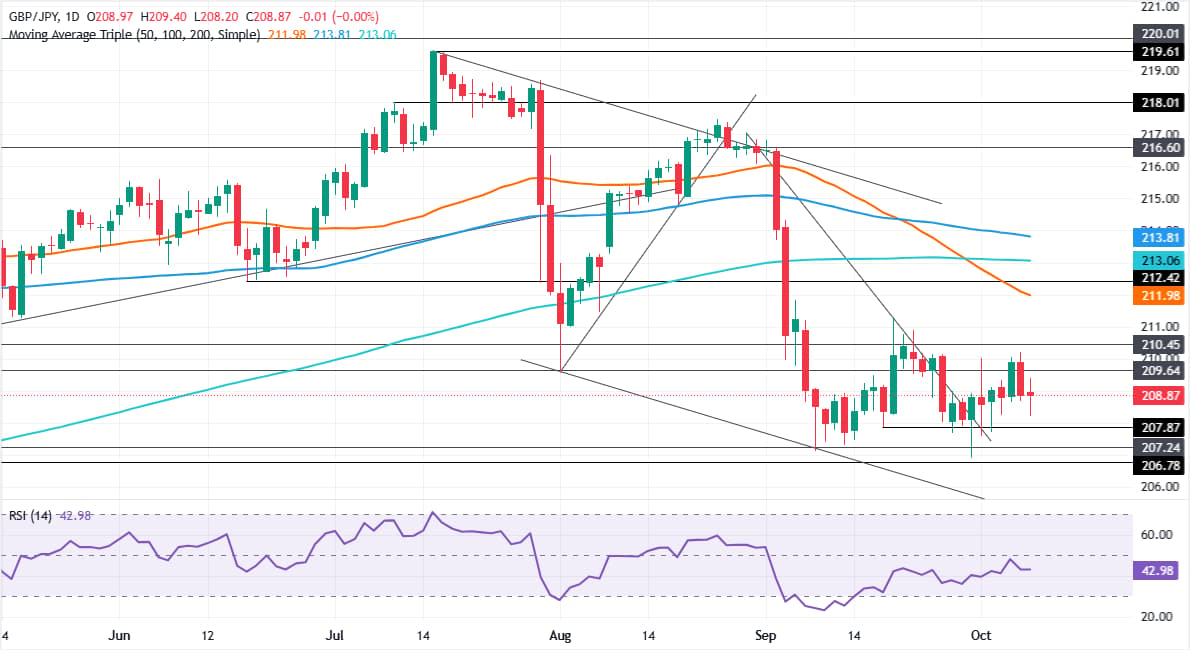
GBP/JPY daily chart

Japanese Yen Price Today

The table below shows the percentage change of Japanese Yen (JPY) against listed major currencies today. Japanese Yen was the strongest against the Australian Dollar.

USD EUR GBP JPY CAD AUD NZD CHF
USD -0.15% -0.12% -0.14% -0.21% 0.14% -0.12% -0.24%
EUR 0.15% 0.03% 0.02% -0.08% 0.22% 0.06% -0.08%
GBP 0.12% -0.03% 0.00% -0.08% 0.17% 0.02% -0.10%
JPY 0.14% -0.02% 0.00% -0.11% 0.19% -0.01% -0.08%
CAD 0.21% 0.08% 0.08% 0.11% 0.31% 0.14% -0.02%
AUD -0.14% -0.22% -0.17% -0.19% -0.31% -0.13% -0.28%
NZD 0.12% -0.06% -0.02% 0.00% -0.14% 0.13% -0.07%
CHF 0.24% 0.08% 0.10% 0.08% 0.02% 0.28% 0.07%

The heat map shows percentage changes of major currencies against each other. The base currency is picked from the left column, while the quote currency is picked from the top row. For example, if you pick the Japanese Yen from the left column and move along the horizontal line to the US Dollar, the percentage change displayed in the box will represent JPY (base)/USD (quote).

Disclaimer: For information purposes only. Past performance is not indicative of future results.
placeholder
Gold Price Forecast: XAU/USD recovers some lost ground above $2,050, US ADP report eyedGold price (XAU/USD) bounces off the multi-day lows near $2030 per ounce and hovers around $2,042 during the early Asian session on Thursday.
Author  FXStreet
Jan 04, 2024
Gold price (XAU/USD) bounces off the multi-day lows near $2030 per ounce and hovers around $2,042 during the early Asian session on Thursday.
placeholder
Gold prices rise to over one-month high on softer dollar, bond yieldsGold prices climbed on Tuesday to their highest point in more than a month, supported by a weaker U.S. dollar and lower Treasury yields.
Author  Reuters
Jul 22, 2025
Gold prices climbed on Tuesday to their highest point in more than a month, supported by a weaker U.S. dollar and lower Treasury yields.
placeholder
Gold holds steady below $4,150 amid elevated US yields Gold price (XAU/USD) trades on a flat note near $4,140 during the early Asian session on Tuesday. Pressure from a stronger US Dollar (USD) and elevated US Treasury yields was offset by reduced expectations of a Federal Reserve (Fed) rate hike this month.
Author  FXStreet
Oct 06, Tue
Gold price (XAU/USD) trades on a flat note near $4,140 during the early Asian session on Tuesday. Pressure from a stronger US Dollar (USD) and elevated US Treasury yields was offset by reduced expectations of a Federal Reserve (Fed) rate hike this month.
placeholder
WTI rises to near $89.50 as Middle East supply threats offset Persian Gulf recoveryWest Texas Intermediate (WTI) oil price extends its gains for the second successive day, trading around $89.50 per barrel during the Asian hours on Wednesday. Crude oil climbed as persistent risks to Middle East energy flows overshadowed signs of rising supply from the region.
Author  FXStreet
Oct 07, Wed
West Texas Intermediate (WTI) oil price extends its gains for the second successive day, trading around $89.50 per barrel during the Asian hours on Wednesday. Crude oil climbed as persistent risks to Middle East energy flows overshadowed signs of rising supply from the region.
placeholder
Gold falls to a two-month low as real yields bite — can $4,000 hold?Gold hit a two-month low on 7 October, with spot touching roughly $4,090 and COMEX December futures closing at $4,140.70, even as the New York Fed's one-year inflation expectation rose to 3.9% — its highest since May 2023. The paradox resolves through real yields: the 30-year Treasury yield reached 5.732% intraday, its highest since 2002. Here are the levels, the institutional split, and the scenarios into tonight's jobless claims and 30-year auction.
Author  Irene Q.
16 hours ago
Gold hit a two-month low on 7 October, with spot touching roughly $4,090 and COMEX December futures closing at $4,140.70, even as the New York Fed's one-year inflation expectation rose to 3.9% — its highest since May 2023. The paradox resolves through real yields: the 30-year Treasury yield reached 5.732% intraday, its highest since 2002. Here are the levels, the institutional split, and the scenarios into tonight's jobless claims and 30-year auction.
Related Instrument
goTop
quote