


Australian Dollar outperforms risky peers despite weak Trade Balance data
- The Australian Dollar gains against its major peers even as Trade Balance data for August remains weak.
- Australian Trade Surplus shrank to A$495 million in August from A$1,351M in July.
- The RBA hiked its interest rates by 25 bps to 4.6% on Tuesday.
The Australian Dollar (AUD) trades higher against its risky peers, but is down versus safe-haven peers during the European trading session on Thursday.
Australian Dollar Price Today
The table below shows the percentage change of Australian Dollar (AUD) against listed major currencies today. Australian Dollar was the strongest against the Japanese Yen.
| USD | EUR | GBP | JPY | CAD | AUD | NZD | CHF | |
|---|---|---|---|---|---|---|---|---|
| USD | 0.30% | 0.34% | 0.46% | 0.09% | -0.02% | 0.35% | -0.02% | |
| EUR | -0.30% | 0.03% | 0.13% | -0.27% | -0.33% | 0.03% | -0.33% | |
| GBP | -0.34% | -0.03% | 0.10% | -0.27% | -0.36% | 0.00% | -0.36% | |
| JPY | -0.46% | -0.13% | -0.10% | -0.37% | -0.46% | -0.10% | -0.46% | |
| CAD | -0.09% | 0.27% | 0.27% | 0.37% | -0.09% | 0.27% | -0.09% | |
| AUD | 0.02% | 0.33% | 0.36% | 0.46% | 0.09% | 0.38% | 0.03% | |
| NZD | -0.35% | -0.03% | -0.01% | 0.10% | -0.27% | -0.38% | -0.33% | |
| CHF | 0.02% | 0.33% | 0.36% | 0.46% | 0.09% | -0.03% | 0.33% |
The heat map shows percentage changes of major currencies against each other. The base currency is picked from the left column, while the quote currency is picked from the top row. For example, if you pick the Australian Dollar from the left column and move along the horizontal line to the US Dollar, the percentage change displayed in the box will represent AUD (base)/USD (quote).
The antipodean gains even as Australian Trade Balance data for August remained weak. Earlier in the day, the Trade Balance report showed that Surplus narrowed sharply to A$495 million in August, compared to a surplus of A$1,351M in the previous reading (revised from A$1,923M). The data signaled that a strong growth in country’s imports shrank the overall trade data.
Imports grew by 5.8% in August after declining 2.4% in July. Exports rose 3.7% that also contracted 3.6% the previous month.
On the monetary policy front, the Reserve Bank of Australia (RBA) hiked interest rates by 25 basis points (bps) to 4.6% on Tuesday. This was the fourth interest rate hike of 25 bps by the RBA of the year. RBA Governor Michele Bullock kept the door open for further monetary policy tightening, citing that the central bank is committed to bring inflation down to the 2% target.
Against the US Dollar (USD), the Australian currency is almost flat at around 0.6945. The US Dollar trades broadly firm due to strong capital inflows amid surging United States (US) Treasury Yields. During the day, 10-year US Treasury Yields post a fresh two-decade high near 5.34%.
Dollar support underpinned as higher US yields draw capital inflows
Societe Generale’s Kit Juckes argues that recent US policy proposals and the associated rise in yields are reinforcing a stronger Dollar outlook. He notes that attempts to talk the Dollar lower have largely failed since the Fed began raising rates, with higher US yields instead attracting capital inflows at a time when Europe faces mounting growth risks amid the global energy crisis. According to Societe Generale, the US is, for now, “solving” the need for greater capital inflows in a world that is increasingly nervous about US policies “by offering higher yields.” In their view, that dynamic “will keep money flowing into the country and support the Dollar until growth begins to suffer.”
AUD/USD Technical Analysis
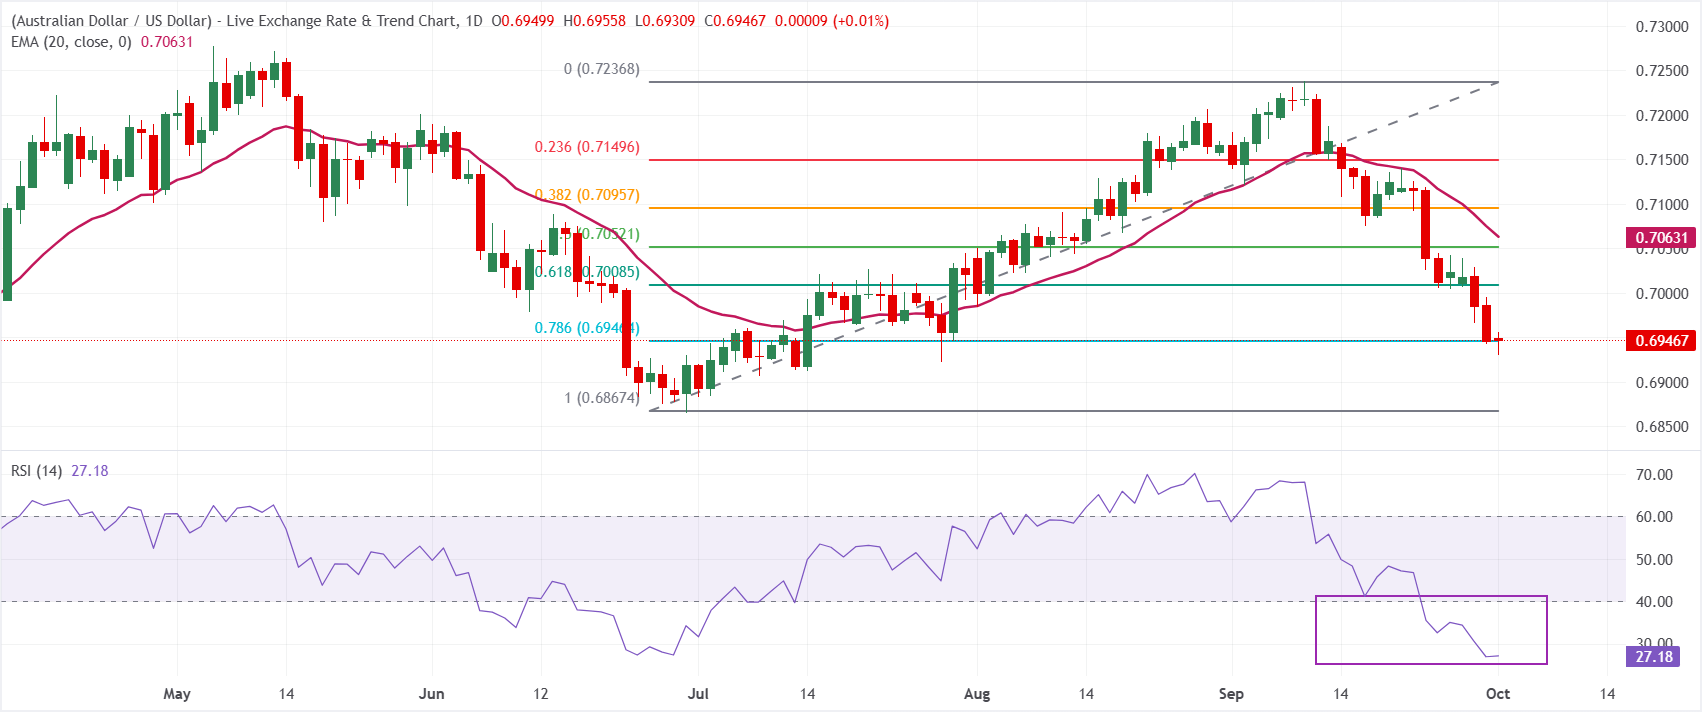
In the daily chart, AUD/USD trades at 0.6947, keeping a bearish near-term bias as spot holds beneath the 20-day exponential moving average (EMA) at 0.7063 and a dense band of Fibonacci resistances. The pair is hovering just above the 78.6% retracement at 0.6946, turning that level into a fragile floor, while the Relative Strength Index (RSI) at 27.2 slips into oversold territory, hinting that downside momentum is stretched but not yet reversed.
On the topside, initial resistance is seen at the 61.8% Fibonacci retracement at 0.7008, followed by the 50.0% retracement at 0.7052 and the 20-day EMA at 0.7063, with further caps at the 38.2% level at 0.7096 and the 23.6% retracement at 0.7150 before the anchor high near 0.7237. On the downside, immediate support aligns with the 78.6% retracement at 0.6946, with a break exposing the 100.0% Fibonacci level at 0.6867 as the next bearish target.
(The technical analysis of this story was written with the help of an AI tool. Know more.)
Economic Indicator
Trade Balance (MoM)
The trade balance released by the Australian Bureau of Statistics is the difference in the value of its imports and exports of Australian goods. Export data can give an important reflection of Australian growth, while imports provide an indication of domestic demand. Trade Balance gives an early indication of the net export performance. If a steady demand in exchange for Australian exports is seen, that would turn into a positive growth in the trade balance, and that should be positive for the AUD.
Read more.Last release: Thu Oct 01, 2026 01:30
Frequency: Monthly
Actual: 495M
Consensus: -
Previous: 1,923M
Source: Australian Bureau of Statistics
Recommended Articles


