


EUR/USD Price Forecast: Downside pressure might intensify below 1.1300
- EUR/USD trades lower at around 1.1310 as the US Dollar outperforms.
- US Treasury Yields surge as investors shrug-off moderate growth in US PCE Inflation data.
- Investors await the Eurozone HICP data for September releasing on Friday.
The Euro (EUR) is down 0.16% at around 1.1310 against the US Dollar (USD) during the European trading session on Thursday. The major currency pair is under pressure as the US Dollar outperforms due to surging United States (US) Treasury Yields.
US Dollar Price Today
The table below shows the percentage change of US Dollar (USD) against listed major currencies today. US Dollar was the strongest against the Japanese Yen.
| USD | EUR | GBP | JPY | CAD | AUD | NZD | CHF | |
|---|---|---|---|---|---|---|---|---|
| USD | 0.10% | 0.00% | 0.46% | 0.04% | -0.11% | 0.23% | 0.11% | |
| EUR | -0.10% | -0.09% | 0.32% | -0.10% | -0.21% | 0.11% | 0.00% | |
| GBP | -0.01% | 0.09% | 0.42% | 0.02% | -0.13% | 0.23% | 0.10% | |
| JPY | -0.46% | -0.32% | -0.42% | -0.42% | -0.56% | -0.24% | -0.34% | |
| CAD | -0.04% | 0.10% | -0.02% | 0.42% | -0.14% | 0.18% | 0.08% | |
| AUD | 0.11% | 0.21% | 0.13% | 0.56% | 0.14% | 0.34% | 0.24% | |
| NZD | -0.23% | -0.11% | -0.23% | 0.24% | -0.18% | -0.34% | -0.08% | |
| CHF | -0.11% | -0.00% | -0.10% | 0.34% | -0.08% | -0.24% | 0.08% |
The heat map shows percentage changes of major currencies against each other. The base currency is picked from the left column, while the quote currency is picked from the top row. For example, if you pick the US Dollar from the left column and move along the horizontal line to the Japanese Yen, the percentage change displayed in the box will represent USD (base)/JPY (quote).
As of writing, the US Dollar Index (DXY), which gauges the Greenback’s value against six major currencies, is close to its yearly high of 101.80. 10-year US Treasury Yields have a hit fresh high near 5.30%, the highest level seen in two decades.
US Treasury Yields have surged even as US Personal Consumer Expenditure (PCE) Inflation data for August showed a moderate growth in price pressures.
What is supporting US bond yields
According to TD Securities, the latest US PCE and GDP revisions were “a mixed bag,” combining “hawkish backward adjustments to growth and dovish adjustments to inflation.” The bank argues that “the underlying trend is the key story,” with “robust growth with rising inflation risks” expected to “continue to dominate the Fed's outlook.” In that context, TD Securities says, “we still expect the Fed to lift rates in October, but can't discard a more gradual approach.”
Meanwhile, the Euro is under pressure even as preliminary German Harmonized Index of Consumer Prices (HICP) data for September has come in stronger-than-expected.
Going forward, investors will focus on the flash Eurozone HICP data for September, which will be released on Friday.
EUR/USD Technical Analysis
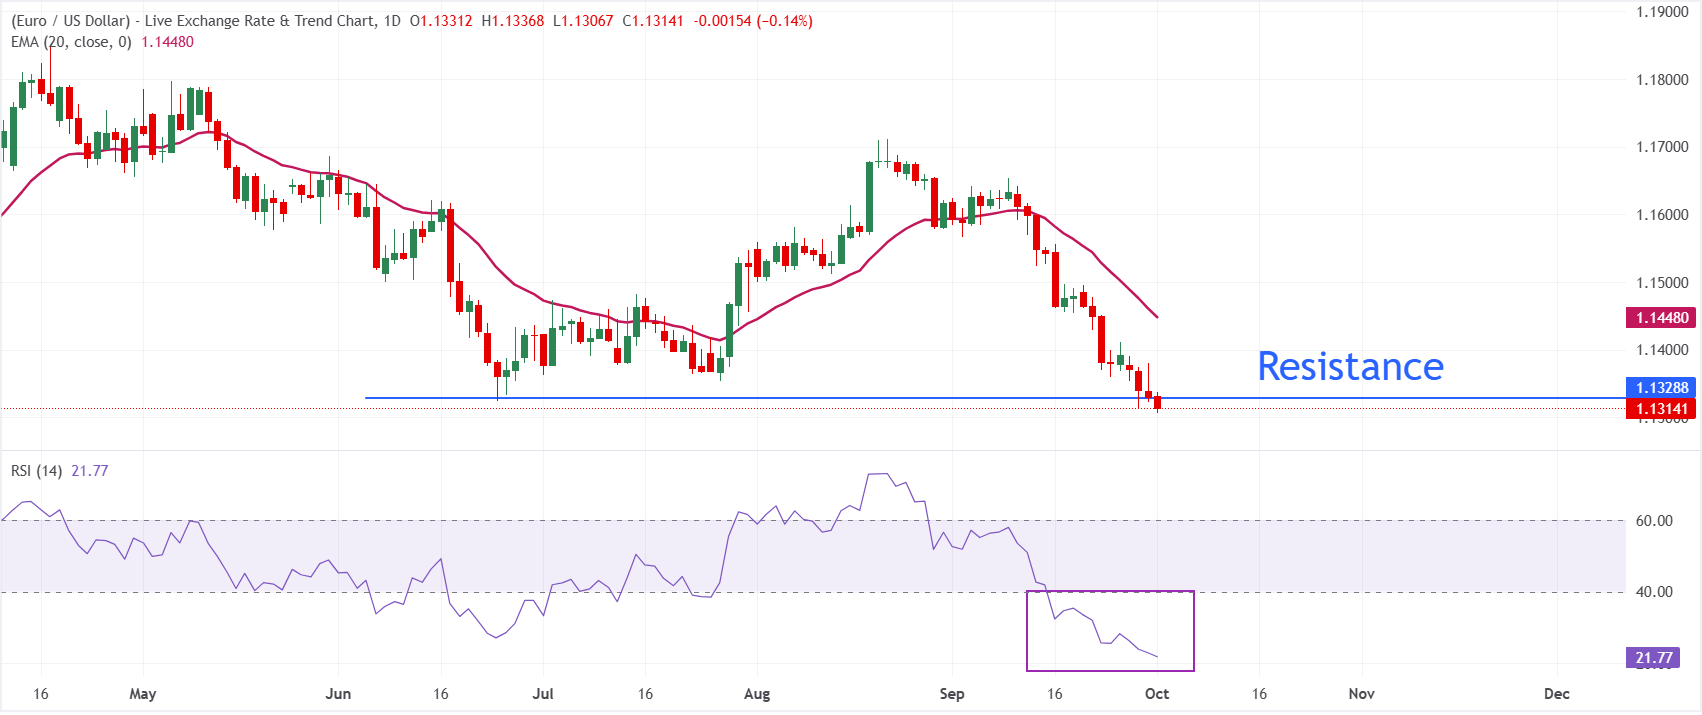
In the daily chart, EUR/USD trades at 1.1314, keeping a clear bearish near-term bias as spot holds beneath the 20-period exponential moving average (EMA) at 1.1448. The pair’s slide away from that EMA resistance suggests sellers remain in control, while the Relative Strength Index (RSI) at 21.8 shows oversold conditions that could slow the downside, but not yet signal a sustainable recovery as long as price stays capped below the short-term trend indicator.
On the topside, the June 24 low at 1.1325 is the immediate resistance, followed by the 20-period EMA at 1.1448, which acts as the first barrier any corrective bounce would need to reclaim to ease the current bearish pressure. Looking down, the downside pressure might inftensify if the pair breaks below 1.1300. On the downside, the 1.1200 would be the next major support level.
(The technical analysis of this story was written with the help of an AI tool. Know more.)
Economic Indicator
Core Personal Consumption Expenditures - Price Index (YoY)
The Core Personal Consumption Expenditures (PCE), released by the US Bureau of Economic Analysis on a monthly basis, measures the changes in the prices of goods and services purchased by consumers in the United States (US). The PCE Price Index is also the Federal Reserve’s (Fed) preferred gauge of inflation. The YoY reading compares the prices of goods in the reference month to the same month a year earlier. The core reading excludes the so-called more volatile food and energy components to give a more accurate measurement of price pressures." Generally, a high reading is bullish for the US Dollar (USD), while a low reading is bearish.
Read more.Last release: Wed Sep 30, 2026 12:30
Frequency: Monthly
Actual: 3%
Consensus: 3.3%
Previous: 3.3%
Source: US Bureau of Economic Analysis
After publishing the GDP report, the US Bureau of Economic Analysis releases the Personal Consumption Expenditures (PCE) Price Index data alongside the monthly changes in Personal Spending and Personal Income. FOMC policymakers use the annual Core PCE Price Index, which excludes volatile food and energy prices, as their primary gauge of inflation. A stronger-than-expected reading could help the USD outperform its rivals as it would hint at a possible hawkish shift in the Fed’s forward guidance and vice versa.
Recommended Articles


