


EUR/GBP Price Forecast: 100-day SMA blocks recovery as momentum remains subdued
- EUR/GBP edges higher as the British Pound remains under pressure on UK fiscal concerns and a less hawkish BoE outlook.
- Technically, the cross remains trapped between the 50-day and 100-day SMAs, keeping the near-term bias broadly neutral.
- Momentum indicators show that neither buyers nor sellers are in clear control.
EUR/GBP edges higher on Tuesday as the British Pound (GBP) remains under pressure across the board, weighed by concerns over the UK’s deteriorating fiscal outlook and the Bank of England’s (BoE) reluctance to raise interest rates while several major central banks have moved toward tighter policy. The cross, however, remains confined to a narrow range, trapped between the 50-day and 100-day Simple Moving Averages (SMAs), keeping the technical bias broadly neutral. At the time of writing, EUR/GBP trades around 0.8580.
Pound Sterling Price Today
The table below shows the percentage change of British Pound (GBP) against listed major currencies today. British Pound was the strongest against the Australian Dollar.
| USD | EUR | GBP | JPY | CAD | AUD | NZD | CHF | |
|---|---|---|---|---|---|---|---|---|
| USD | 0.02% | 0.07% | -0.11% | 0.02% | 0.08% | -0.33% | -0.24% | |
| EUR | -0.02% | 0.04% | -0.11% | 0.05% | 0.06% | -0.35% | -0.26% | |
| GBP | -0.07% | -0.04% | -0.19% | -0.04% | 0.00% | -0.41% | -0.30% | |
| JPY | 0.11% | 0.11% | 0.19% | 0.14% | 0.20% | -0.22% | -0.10% | |
| CAD | -0.02% | -0.05% | 0.04% | -0.14% | 0.07% | -0.34% | -0.24% | |
| AUD | -0.08% | -0.06% | -0.00% | -0.20% | -0.07% | -0.41% | -0.31% | |
| NZD | 0.33% | 0.35% | 0.41% | 0.22% | 0.34% | 0.41% | 0.11% | |
| CHF | 0.24% | 0.26% | 0.30% | 0.10% | 0.24% | 0.31% | -0.11% |
The heat map shows percentage changes of major currencies against each other. The base currency is picked from the left column, while the quote currency is picked from the top row. For example, if you pick the British Pound from the left column and move along the horizontal line to the US Dollar, the percentage change displayed in the box will represent GBP (base)/USD (quote).
Pound stays heavy as tighter UK fiscal stance threatens dovish BoE repricing
Strategists at Brown Brothers Harriman note that the UK’s fiscal backdrop is turning more restrictive. They point out that “the UK government borrowed £18.3bn in August, up £2.9bn from August 2025 and £3.5 billion above the Office for Budget Responsibility forecast,” a dynamic that has sharply eroded fiscal space. BBH adds that “higher borrowing costs are estimated to have halved the government’s fiscal headroom to around £12bn,” leaving Chancellor John Healey under mounting pressure “to raise taxes and cut spending to deliver his promised ‘buffer against uncertainty’ in the October 28 Autumn Budget.”
In BBH’s view, the “bottom line” is that “a tighter UK fiscal squeeze suggests the BoE may not need to raise the policy rate as much as markets expect (100bps in the next twelve months to 4.75%).” As a result, they warn that “GBP is vulnerable to a dovish BoE repricing.”
Technical analysis
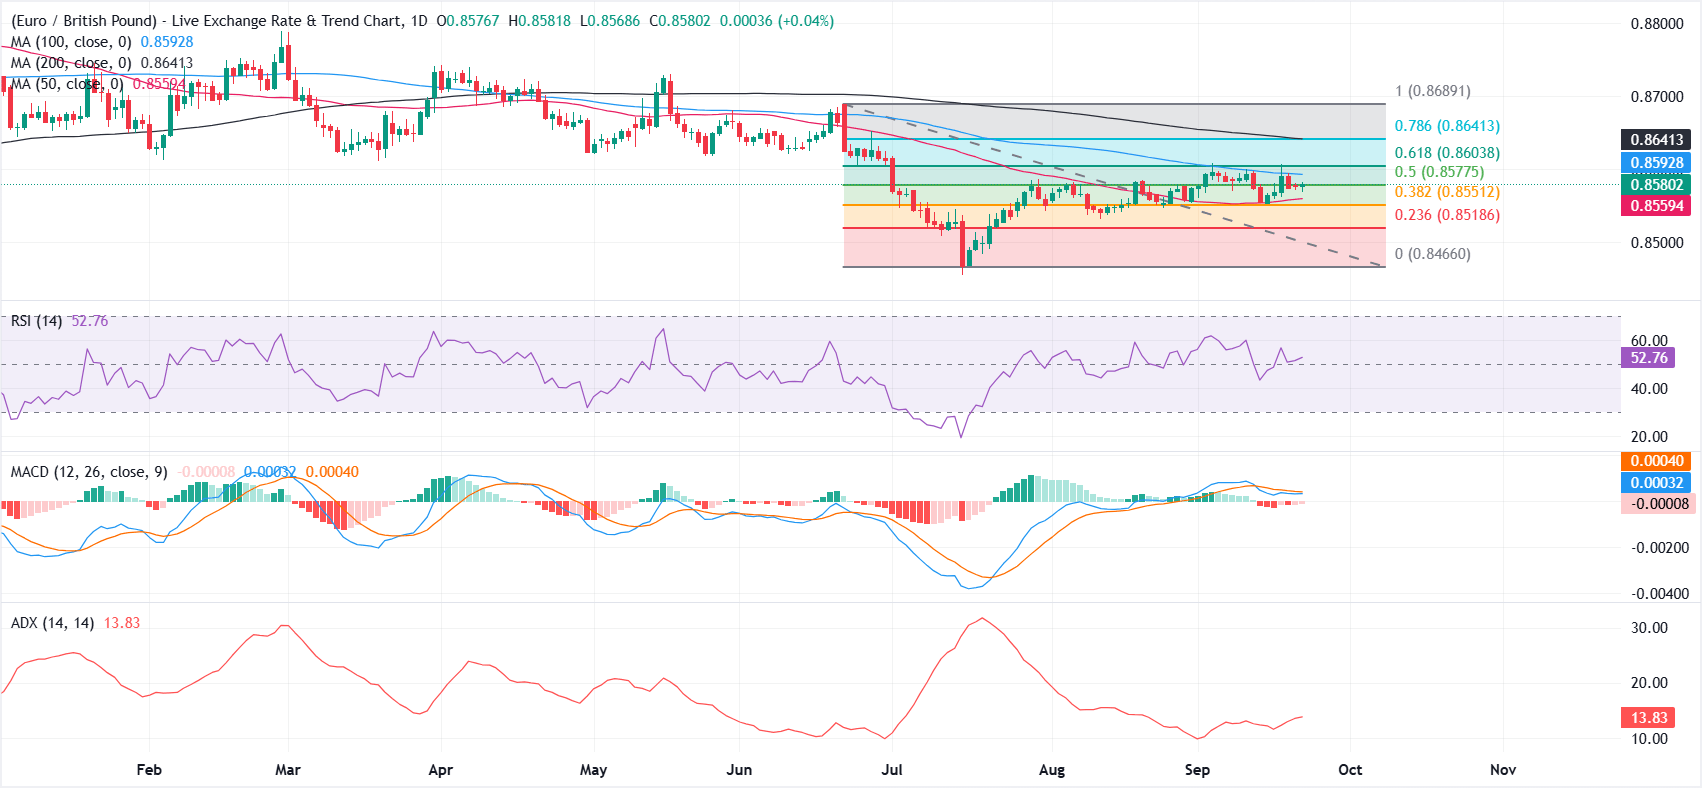
On the daily chart, EUR/GBP keeps a capped tone as it holds beneath the 100-day simple moving average (SMA) at 0.8593 and the 200-day SMA clustered with the 78.6% Fibonacci retracement at 0.8641. The pair is marginally above the 50-day SMA at 0.8559 and the 50.0% retracement at 0.8578, but these nearby supports have yet to trigger a decisive rebound.
The Relative Strength Index (14) around 53 hints at mildly positive momentum, while the Moving Average Convergence Divergence (MACD) is fractionally below zero with a flat profile, and a low Average Directional Index (ADX) near 14 together suggest a weak, directionless market still biased lower while price remains under the key medium-term averages.
On the topside, initial resistance comes at the 100-day SMA around 0.8593, followed by the 61.8% Fibonacci retracement at 0.8604, before a more significant barrier emerges at the dense 0.8641 zone where the 200-day SMA and 78.6% retracement converge; beyond that, the cycle high at the 100.0% level of 0.8689 marks a broader upside cap.
On the downside, immediate support is seen just under the market at the 50.0% retracement near 0.8578, with the 50-day SMA at 0.8559 and the 38.2% retracement at 0.8551 forming a secondary demand band; a deeper slide would expose the 23.6% level at 0.8519 and the structural anchor around 0.8466.
(The technical analysis of this story was written with the help of an AI tool. Know more.)
BoE FAQs
The Bank of England (BoE) decides monetary policy for the United Kingdom. Its primary goal is to achieve ‘price stability’, or a steady inflation rate of 2%. Its tool for achieving this is via the adjustment of base lending rates. The BoE sets the rate at which it lends to commercial banks and banks lend to each other, determining the level of interest rates in the economy overall. This also impacts the value of the Pound Sterling (GBP).
When inflation is above the Bank of England’s target it responds by raising interest rates, making it more expensive for people and businesses to access credit. This is positive for the Pound Sterling because higher interest rates make the UK a more attractive place for global investors to park their money. When inflation falls below target, it is a sign economic growth is slowing, and the BoE will consider lowering interest rates to cheapen credit in the hope businesses will borrow to invest in growth-generating projects – a negative for the Pound Sterling.
In extreme situations, the Bank of England can enact a policy called Quantitative Easing (QE). QE is the process by which the BoE substantially increases the flow of credit in a stuck financial system. QE is a last resort policy when lowering interest rates will not achieve the necessary result. The process of QE involves the BoE printing money to buy assets – usually government or AAA-rated corporate bonds – from banks and other financial institutions. QE usually results in a weaker Pound Sterling.
Quantitative tightening (QT) is the reverse of QE, enacted when the economy is strengthening and inflation starts rising. Whilst in QE the Bank of England (BoE) purchases government and corporate bonds from financial institutions to encourage them to lend; in QT, the BoE stops buying more bonds, and stops reinvesting the principal maturing on the bonds it already holds. It is usually positive for the Pound Sterling.
Recommended Articles


