

GBP/JPY Price Forecast: Evening star puts 207.00 back in play

Source Fxstreet
  • GBP/JPY retreats after failing to sustain gains above 209.00.
  • Bearish RSI nears oversold territory as selling momentum strengthens.
  • Break below 207.10 exposes 206.73 and 205.00 next.

GBP/JPY makes a U-turn and loses about 0.39% on Thursday as risk appetite improves, while traders await a potential rate hike by the Bank of Japan later in Friday’s session. The cross-pair trades at 208.32 after reaching a high of 209.19.

GBP/JPY Price Forecast: Technical Outlook

Price action shows a potential formation of an ‘evening star’, a bearish candle pattern, which means that sellers are pushing the GBP/JPY pair lower, to test yearly lows. Momentum as measured by the Relative Strength Index (RSI) is bearish and about to turn oversold once more, an indication that bearish momentum is building.

That said, GBP/JPY's first support is the September 8 swing low at 207.10. Once surpassed, this would resume the downtrend structure of lower highs and lower lows, putting in play the December 16, 2025, low of the day (LOD)at 206.73, before the cross-pair dives to the psychological 205.00 milestone.

On the other hand, if GBP/JPY rises above the September 16 high of 209.47, a move to 210.00 is on the cards. On further strength, the next area of interest would be the September 4 swing high of 211.82, shy of 212.00.

GBP/JPY Price Chart – Daily
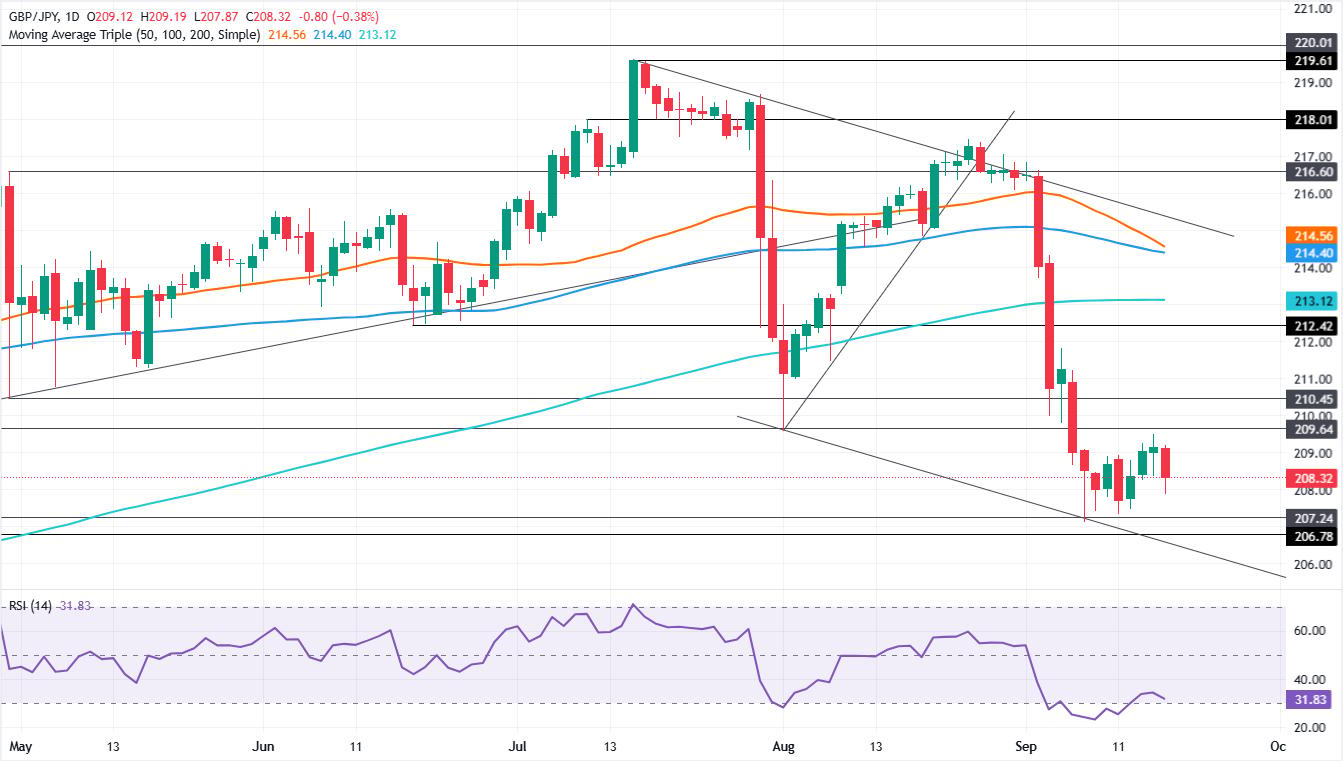
GBP/JPY daily chart

Japanese Yen Price Today

The table below shows the percentage change of Japanese Yen (JPY) against listed major currencies today. Japanese Yen was the strongest against the British Pound.

USD EUR GBP JPY CAD AUD NZD CHF
USD -0.11% 0.19% -0.22% 0.02% -0.32% -0.35% -0.18%
EUR 0.11% 0.30% -0.09% 0.13% -0.23% -0.21% -0.05%
GBP -0.19% -0.30% -0.38% -0.16% -0.52% -0.51% -0.32%
JPY 0.22% 0.09% 0.38% 0.18% -0.11% -0.16% 0.02%
CAD -0.02% -0.13% 0.16% -0.18% -0.32% -0.35% -0.15%
AUD 0.32% 0.23% 0.52% 0.11% 0.32% -0.00% 0.15%
NZD 0.35% 0.21% 0.51% 0.16% 0.35% 0.00% 0.21%
CHF 0.18% 0.05% 0.32% -0.02% 0.15% -0.15% -0.21%

The heat map shows percentage changes of major currencies against each other. The base currency is picked from the left column, while the quote currency is picked from the top row. For example, if you pick the Japanese Yen from the left column and move along the horizontal line to the US Dollar, the percentage change displayed in the box will represent JPY (base)/USD (quote).

Disclaimer: For information purposes only. Past performance is not indicative of future results.
placeholder
Crude Oil Price Forecast: Can Brent Hold $100 Amid Hawkish Fed Rate Hikes and Easing Supply Concerns? International oil prices continued to fall after the Federal Reserve resumed rate hikes in September. On Wednesday, WTI crude dropped 3.28% to settle at $102.02 per barrel; Brent crude fe
Author  TradingKey
11 hours ago
International oil prices continued to fall after the Federal Reserve resumed rate hikes in September. On Wednesday, WTI crude dropped 3.28% to settle at $102.02 per barrel; Brent crude fe
placeholder
Dow drops 631 points as the Fed hikes — but futures are rebounding: what's next for US stocks?The Dow fell 631 points and the S&P 500 closed below 7,600 after the Fed hiked rates for the first time since 2023, with the dot plot showing 16 of 18 officials expect more tightening. Asia-session futures are already recovering — here are the levels and analyst views that decide whether 7,500 holds.
Author  Irene Q.
19 hours ago
The Dow fell 631 points and the S&P 500 closed below 7,600 after the Fed hiked rates for the first time since 2023, with the dot plot showing 16 of 18 officials expect more tightening. Asia-session futures are already recovering — here are the levels and analyst views that decide whether 7,500 holds.
placeholder
Dollar index tops 100 for the first time since July as the Fed's hawkish dot plot sinks inThe U.S. dollar index broke back above 100 for the first time since 31 July after the Fed delivered its first rate hike since 2023, with the dot plot showing 16 of 18 officials expect at least one more increase this year. Here are the levels that matter for DXY, the currencies feeling it most, and what to watch next.
Author  Irene Q.
19 hours ago
The U.S. dollar index broke back above 100 for the first time since 31 July after the Fed delivered its first rate hike since 2023, with the dot plot showing 16 of 18 officials expect at least one more increase this year. Here are the levels that matter for DXY, the currencies feeling it most, and what to watch next.
placeholder
TradingKey Daily Market Briefing: Fed Raises Rates by 25 Bps, May Hike Again This Year; Gold Tumbles as Intel Rises 4%On September 16, Eastern Time, US stocks rose before pulling back following the Federal Reserve's rate decision announcement for September. The Fed unanimously decid
Author  TradingKey
20 hours ago
On September 16, Eastern Time, US stocks rose before pulling back following the Federal Reserve's rate decision announcement for September. The Fed unanimously decid
placeholder
September Fed Rate Decision Preview: Is a Rate Hike a Foregone Conclusion? US Stocks, Dollar, and Gold Face a Critical TestThe Federal Reserve will announce its September interest rate decision at 2:00 p.m. ET on Wednesday (September 16), followed by a press conference held by Fed Chair Kevin Warsh at 2:30 p.
Author  TradingKey
Yesterday 10: 14
The Federal Reserve will announce its September interest rate decision at 2:00 p.m. ET on Wednesday (September 16), followed by a press conference held by Fed Chair Kevin Warsh at 2:30 p.
Related Instrument
goTop
quote