

GBP/JPY Price Forecast: Steadies above 215.00 capped by 50-day SMA

Source Fxstreet
  • GBP/JPY remains trapped near 215.00 as traders avoid directional bets.
  • Flat RSI signals consolidation while 50-day SMA caps upside.
  • Break below 214.57 exposes 200-day SMA and 211.47.

The GBP/JPY remains directionless on Thursday as traders turn cautious about opening fresh directional bets amid intervention fears in the FX markets, which could strengthen the Yen, and after solid UK data. The cross-pair sits at around 215.00, down 0.02%.

GBP/JPY Price Forecast: Technical Outlook

GBP/JPY faced strong resistance at around the 50-day Simple Moving Average (SMA) at 215.44. leading to sideways movement. The Relative Strength Index (RSI) turned flat at around its 50-neutral level, hinting that further consolidation lies ahead.

For a bullish resumption, the first resistance levels is the 50-day SMA and then the 216.00 milestone. A decisive break opens the path to 216.50 and ultimately reaches the 217.00 psychological barrier.

On the flip side, the GBP/JPY finds support at 215.00, with the 100-day SMA at 214.57 being up next. Beneath this area, the 200-day SMA stands at 212.12, just above the August 7 low of 211.47.

GBP/JPY Price Chart – Daily
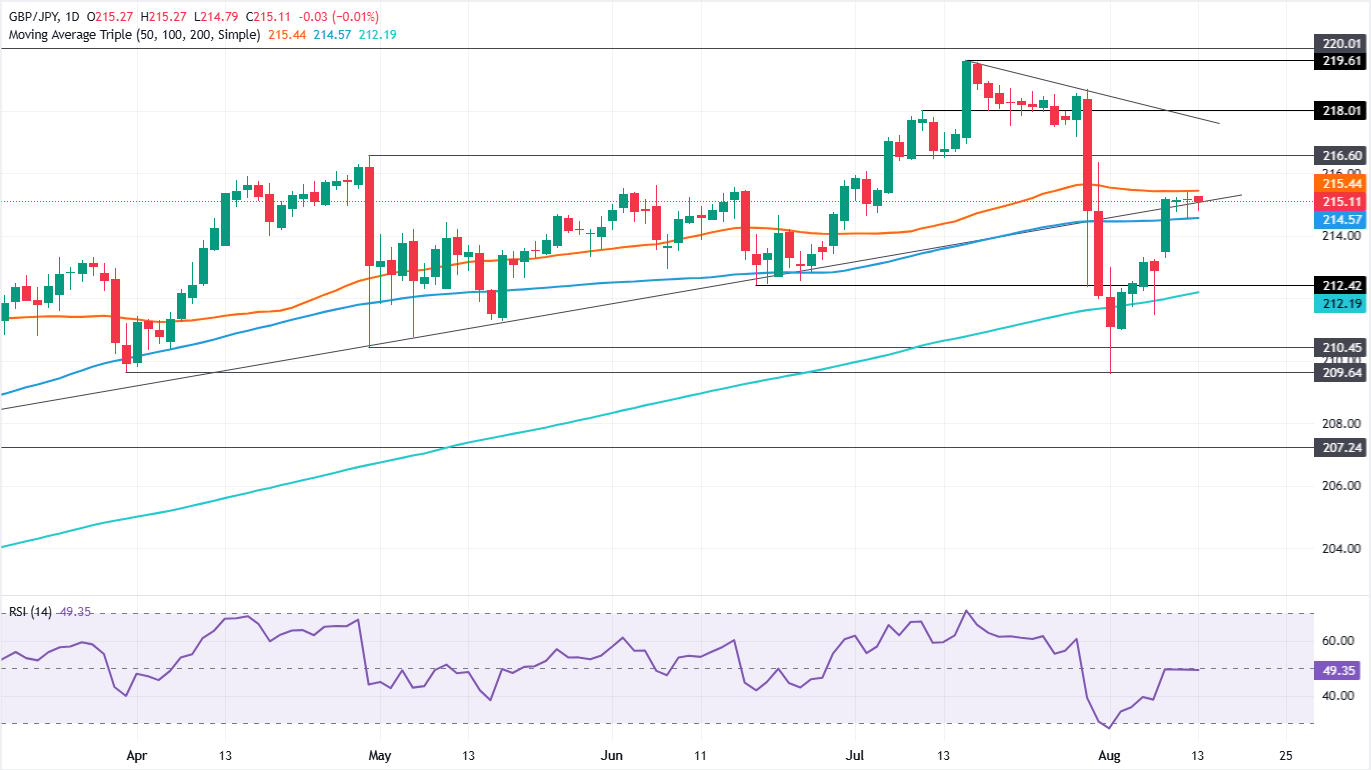
GBP/JPY daily chart

Japanese Yen Price This week

The table below shows the percentage change of Japanese Yen (JPY) against listed major currencies this week. Japanese Yen was the strongest against the Swiss Franc.

USD EUR GBP JPY CAD AUD NZD CHF
USD 0.18% -0.00% 1.10% -0.15% 0.03% 0.72% 0.78%
EUR -0.18% -0.20% 0.86% -0.41% -0.22% 0.46% 0.50%
GBP 0.00% 0.20% 1.01% -0.22% -0.02% 0.64% 0.69%
JPY -1.10% -0.86% -1.01% -0.92% -0.72% -0.20% -0.09%
CAD 0.15% 0.41% 0.22% 0.92% 0.21% 0.73% 0.98%
AUD -0.03% 0.22% 0.02% 0.72% -0.21% 0.66% 0.70%
NZD -0.72% -0.46% -0.64% 0.20% -0.73% -0.66% 0.05%
CHF -0.78% -0.50% -0.69% 0.09% -0.98% -0.70% -0.05%

The heat map shows percentage changes of major currencies against each other. The base currency is picked from the left column, while the quote currency is picked from the top row. For example, if you pick the Japanese Yen from the left column and move along the horizontal line to the US Dollar, the percentage change displayed in the box will represent JPY (base)/USD (quote).


Disclaimer: For information purposes only. Past performance is not indicative of future results.
placeholder
Financial Markets 2026: Volatility Catalysts in Gold, Silver, Oil, and Blue-Chip Stocks—A CFD Trader's OutlookGet a comprehensive financial market 2026 outlook exploring key economic drivers, volatility catalysts in gold, oil and stocks, and what the evolving economic outlook means for cfd trading strategies and risk management on global markets.
Author  Rachel Weiss
May 15, Fri
Get a comprehensive financial market 2026 outlook exploring key economic drivers, volatility catalysts in gold, oil and stocks, and what the evolving economic outlook means for cfd trading strategies and risk management on global markets.
placeholder
Finding The Best Japan Stocks to Buy? These are Top Japanese Companies to Watch Discover the best Japanese stocks to buy, including AI semiconductor leaders, Buffett-backed trading houses, and undervalued Japan stocks benefiting from corporate reforms and yen trends.
Author  Mitrade
May 29, Fri
Discover the best Japanese stocks to buy, including AI semiconductor leaders, Buffett-backed trading houses, and undervalued Japan stocks benefiting from corporate reforms and yen trends.
placeholder
Gold Price Forecast: Cooling Rate Hike Expectations Push Gold Above $4,400, Eyeing $4,500 Next As of the European session on August 11, gold prices (XAUUSD) briefly topped $4,400 intraday, reaching a high of $4,435.2, its highest level since June 5. However, gains subsequently narr
Author  TradingKey
Aug 11, Tue
As of the European session on August 11, gold prices (XAUUSD) briefly topped $4,400 intraday, reaching a high of $4,435.2, its highest level since June 5. However, gains subsequently narr
placeholder
WTI declines below $82.50 as oil inventories rise far more than expectedWest Texas Intermediate (WTI), the US crude oil benchmark, is trading around $82.45 during the early Asian trading hours on Thursday. WTI declines on a larger-than-expected build in US crude oil inventories. Traders will closely monitor the developments surrounding US-Iran talks for fresh impetus. 
Author  FXStreet
23 hours ago
West Texas Intermediate (WTI), the US crude oil benchmark, is trading around $82.45 during the early Asian trading hours on Thursday. WTI declines on a larger-than-expected build in US crude oil inventories. Traders will closely monitor the developments surrounding US-Iran talks for fresh impetus. 
placeholder
Forex Today: US Dollar stabilizes ahead of next batch of US dataHere is what you need to know on Thursday, August 13:
Author  FXStreet
15 hours ago
Here is what you need to know on Thursday, August 13:
Related Instrument
goTop
quote