

GBP/USD eases ahead of bloated data docket

Source Fxstreet
  • GBP/USD slipped back below 1.3500 on Tuesday.
  • The back half of the week brings plenty of meaningful data and policy releases.
  • UK CPI inflation data and Fed meeting minutes are on deck for Wednesday.

GBP/USD eased lower on Tuesday, edging back below 1.3500 as Cable traders await a reason to make a move. The trading week opened up with little of note on the economic data docket, leaving markets to react to headline flows that remained constrained.

All of that changes beginning on Wednesday. The United Kingdom’s (UK) latest Consumer Price Index (CPI) inflation figures will be released during the upcoming London market session, followed by the latest interest rate decision meeting minutes from the Federal Reserve (Fed) during the New York market hours.
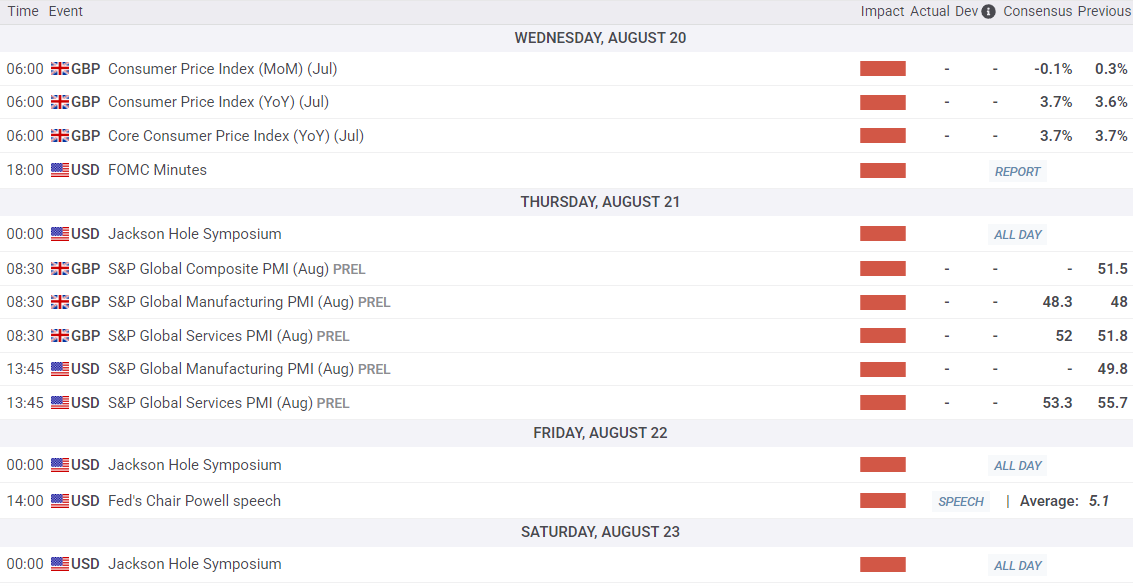
Core UK CPI inflation is expected to hold steady near 3.7% YoY, while headline inflation figures for the same period are expected to tick up to 3.7% from 3.6%. The Fed’s latest meeting minutes are unlikely to reveal any new information, but will nonetheless give policy watchers fresh bones from the same carcass to gnaw on.

Global Purchasing Managers Index (PMI) will drop on Thursday for both the UK and the US, and this year’s Jackson Hole economic symposium also gets underway. UK PMI figures are generally expected to rise on both the services and manufacturing components, while a contraction in US services PMI figures is expected.

GBP/USD price forecast

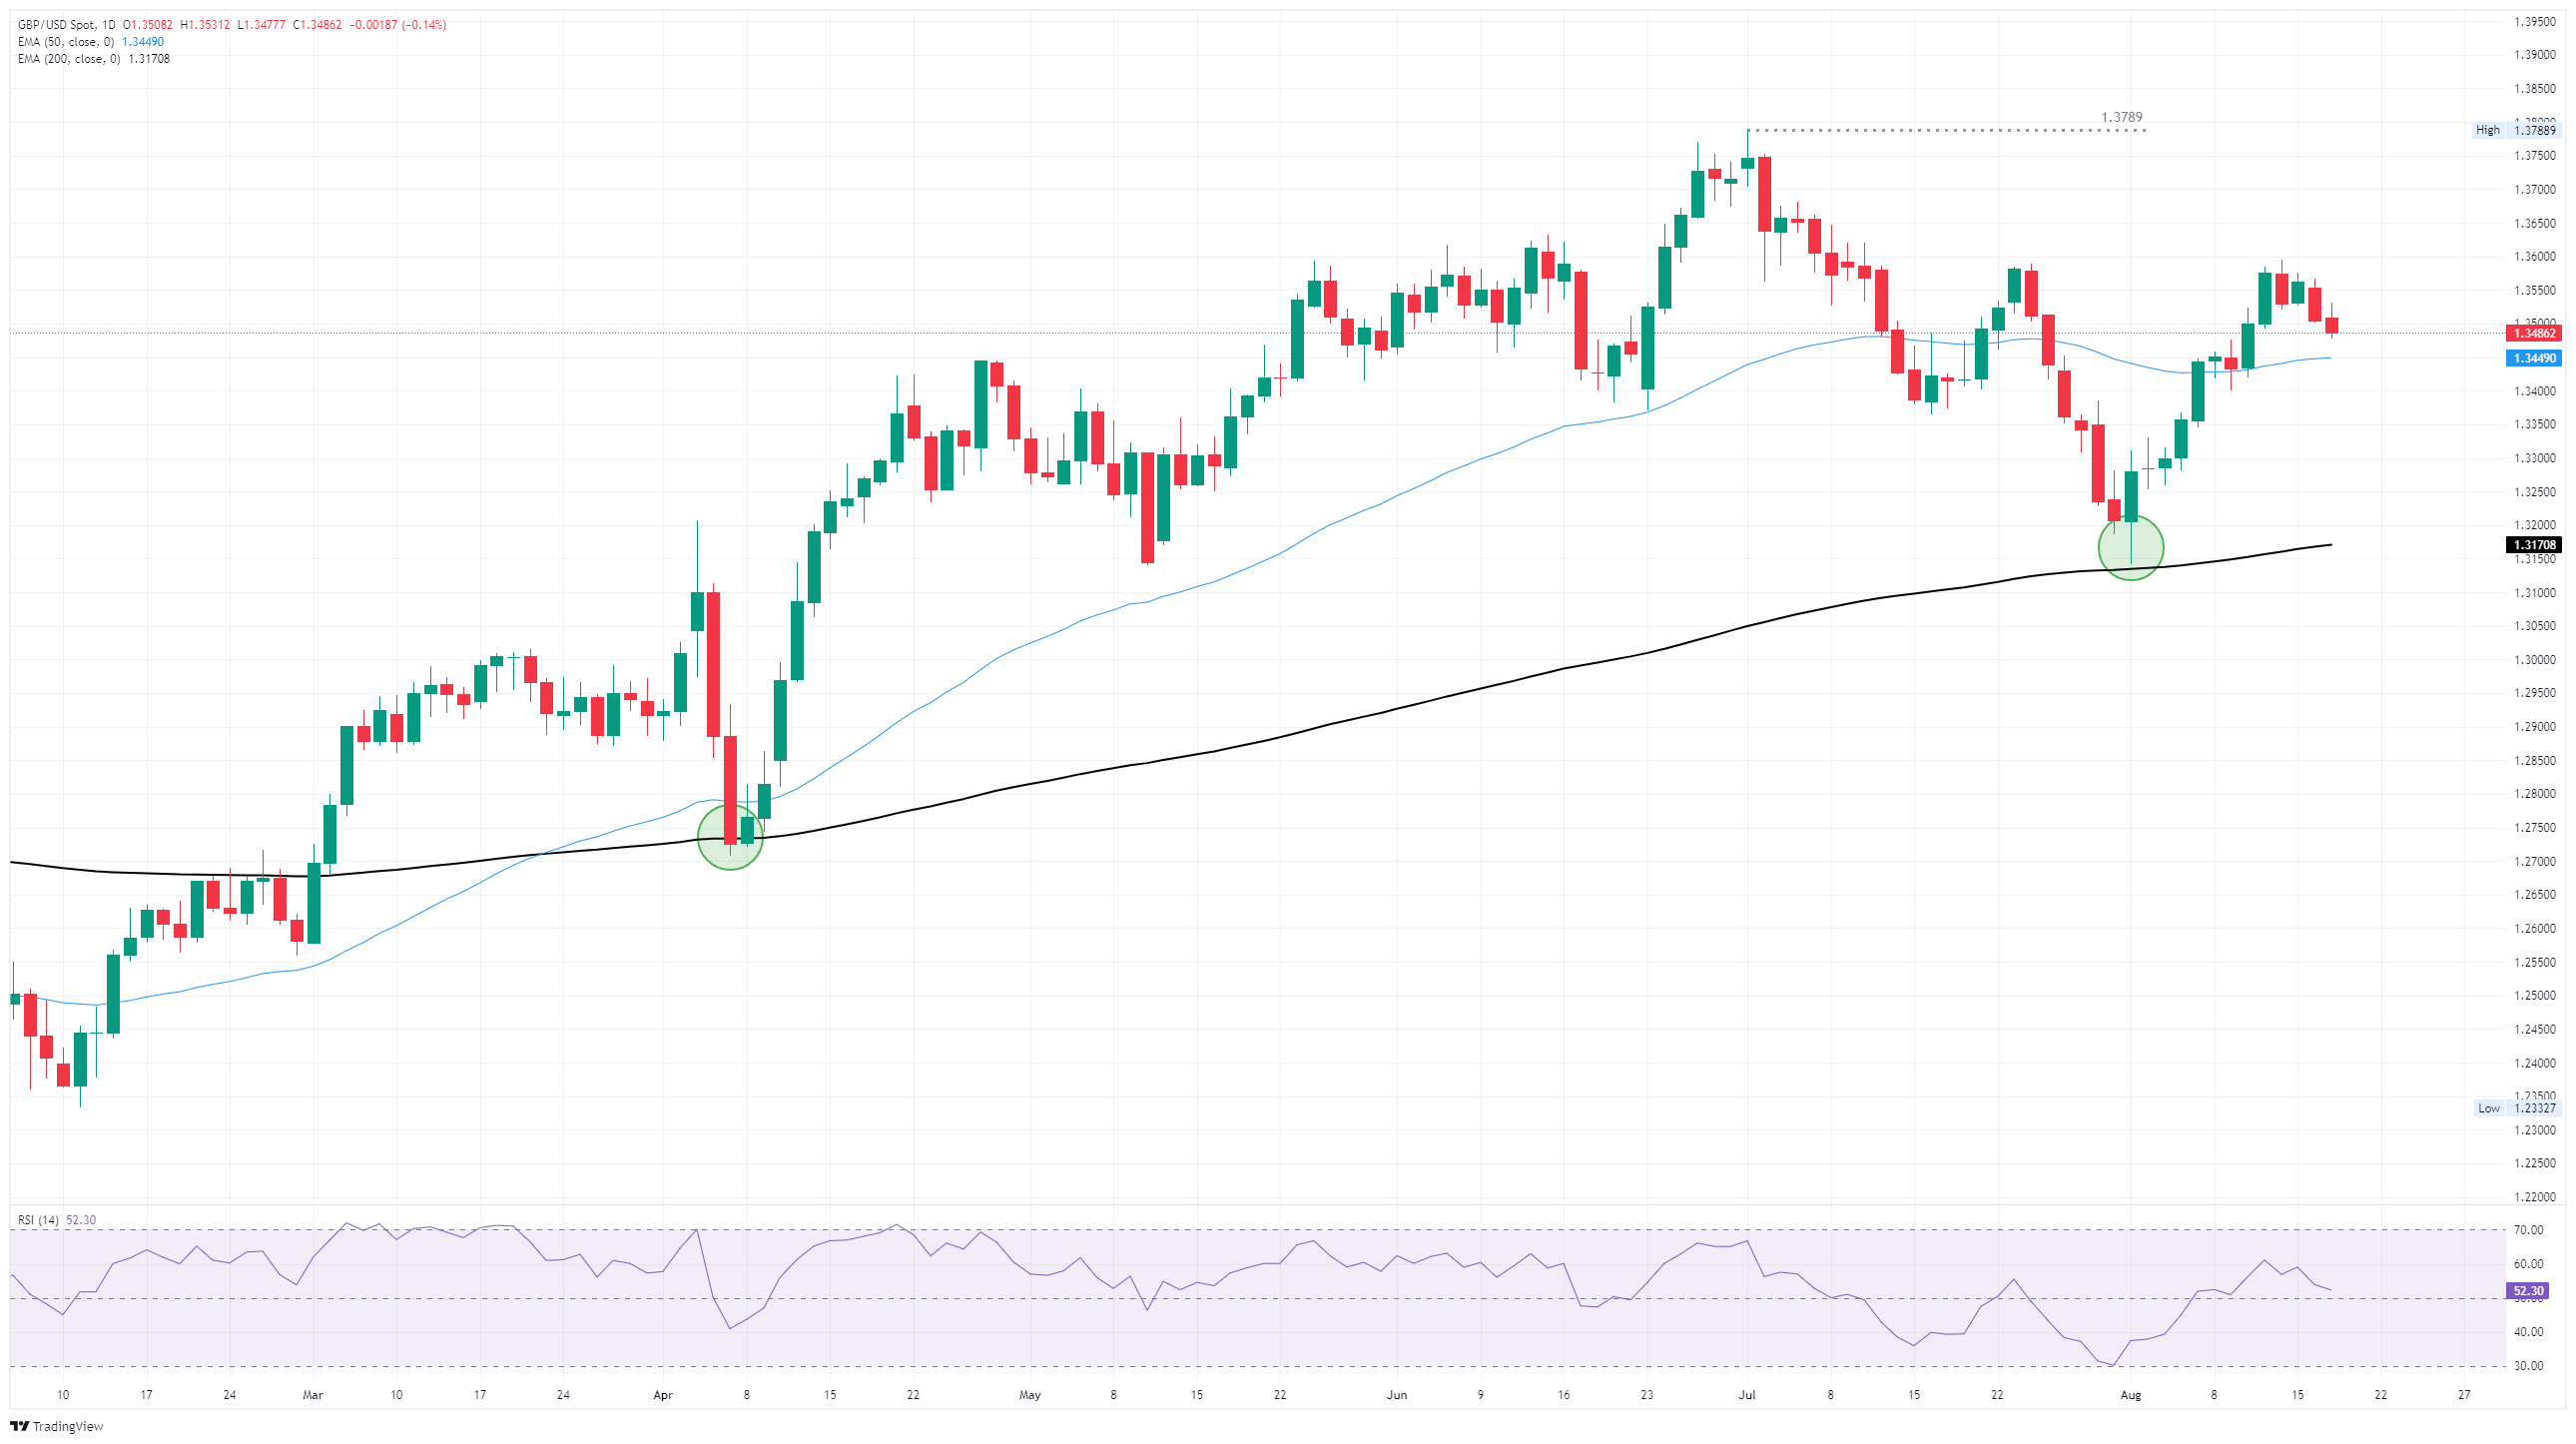
Tuesday’s bearish continuation has put GBP/USD on pace for a fresh challenge of technical support at the 50-day Exponential Moving Average (EMA) near 1.3450. However, Cable is still firmly entrenched deep in bull country, with the pair trading well north of the 200-day EMA near 1.3170.

GBP/USD daily chart

Pound Sterling FAQs

The Pound Sterling (GBP) is the oldest currency in the world (886 AD) and the official currency of the United Kingdom. It is the fourth most traded unit for foreign exchange (FX) in the world, accounting for 12% of all transactions, averaging $630 billion a day, according to 2022 data. Its key trading pairs are GBP/USD, also known as ‘Cable’, which accounts for 11% of FX, GBP/JPY, or the ‘Dragon’ as it is known by traders (3%), and EUR/GBP (2%). The Pound Sterling is issued by the Bank of England (BoE).

The single most important factor influencing the value of the Pound Sterling is monetary policy decided by the Bank of England. The BoE bases its decisions on whether it has achieved its primary goal of “price stability” – a steady inflation rate of around 2%. Its primary tool for achieving this is the adjustment of interest rates. When inflation is too high, the BoE will try to rein it in by raising interest rates, making it more expensive for people and businesses to access credit. This is generally positive for GBP, as higher interest rates make the UK a more attractive place for global investors to park their money. When inflation falls too low it is a sign economic growth is slowing. In this scenario, the BoE will consider lowering interest rates to cheapen credit so businesses will borrow more to invest in growth-generating projects.

Data releases gauge the health of the economy and can impact the value of the Pound Sterling. Indicators such as GDP, Manufacturing and Services PMIs, and employment can all influence the direction of the GBP. A strong economy is good for Sterling. Not only does it attract more foreign investment but it may encourage the BoE to put up interest rates, which will directly strengthen GBP. Otherwise, if economic data is weak, the Pound Sterling is likely to fall.

Another significant data release for the Pound Sterling is the Trade Balance. This indicator measures the difference between what a country earns from its exports and what it spends on imports over a given period. If a country produces highly sought-after exports, its currency will benefit purely from the extra demand created from foreign buyers seeking to purchase these goods. Therefore, a positive net Trade Balance strengthens a currency and vice versa for a negative balance.

Disclaimer: For information purposes only. Past performance is not indicative of future results.
placeholder
Nvidia reports tomorrow with an interim CEO — $108 billion is the easy numberNvidia closed at 162.85 on Friday, down 12.75% on the week and 32% below its 6 October record, with market value down to $3.92 trillion. The Q3 bar is $108 billion ±2%, and consensus already sits at $108.7 ~ 108.8 billion, so the revenue line is not where the surprise lives. The number that decides the reaction is the 71 ~ 72% Q4 gross-margin trough, followed by a Q4 guide against a $124.9 billion consensus. This piece prices the print, marks the 158.39 line and lays out the three scenarios in a table.
Author  Irene Q.
Yesterday 02: 11
Nvidia closed at 162.85 on Friday, down 12.75% on the week and 32% below its 6 October record, with market value down to $3.92 trillion. The Q3 bar is $108 billion ±2%, and consensus already sits at $108.7 ~ 108.8 billion, so the revenue line is not where the surprise lives. The number that decides the reaction is the 71 ~ 72% Q4 gross-margin trough, followed by a Q4 guide against a $124.9 billion consensus. This piece prices the print, marks the 158.39 line and lays out the three scenarios in a table.
placeholder
Anthropic is six times oversubscribed at $1.4 trillion while Nvidia is down 32% — the AI trade has two pricesAnthropic lists on Nasdaq as ANT on Thursday at $70 ~ $78 a share, raising up to $64.4 billion at a target valuation near $1.4 trillion, and the book is reportedly six times covered. In the same six weeks, Nvidia has fallen 32% and the QQQ is 10.9% below its October peak. Private capital and public markets are marking the same AI complex at two very different prices. This piece separates the two books: what the S-1 shows, who is anchoring the $26 billion private placement, and what Thursday's debut would have to do to change the public tape.
Author  Irene Q.
23 hours ago
Anthropic lists on Nasdaq as ANT on Thursday at $70 ~ $78 a share, raising up to $64.4 billion at a target valuation near $1.4 trillion, and the book is reportedly six times covered. In the same six weeks, Nvidia has fallen 32% and the QQQ is 10.9% below its October peak. Private capital and public markets are marking the same AI complex at two very different prices. This piece separates the two books: what the S-1 shows, who is anchoring the $26 billion private placement, and what Thursday's debut would have to do to change the public tape.
placeholder
Weekly Report: The index rose 2.5% while Nvidia fell 12.7% — two equity divergences, one should closeThe S&P 500 rose 2.51% to 7,561.67 and the QQQ rose 3.63% to 679.89 last week, while Nvidia fell 12.75% to 162.85 — a sixth straight weekly loss and 32% below its October record. In the same five sessions, energy equities rose 5.42% while WTI fell 2.52%. Both pairs normally move together (60-day correlations of +0.64 and +0.58). This report ranks which divergence closes first, with the trigger for each.
Author  Irene Q.
23 hours ago
The S&P 500 rose 2.51% to 7,561.67 and the QQQ rose 3.63% to 679.89 last week, while Nvidia fell 12.75% to 162.85 — a sixth straight weekly loss and 32% below its October record. In the same five sessions, energy equities rose 5.42% while WTI fell 2.52%. Both pairs normally move together (60-day correlations of +0.64 and +0.58). This report ranks which divergence closes first, with the trigger for each.
placeholder
Gold Price Analysis Today | Forex Gold Analysis | XAU/USD Analysis - November 16, 2026Get the latest gold price analysis, forex gold insights, and XAU/USD analysis for November 16, 2026. Read on for the details.
Author  Mitrade
23 hours ago
Get the latest gold price analysis, forex gold insights, and XAU/USD analysis for November 16, 2026. Read on for the details.
placeholder
Weekly Report: DXY 103.41, 10-year 5.15%, AUD carry 3bp — three FX regimes flipped in one weekThe dollar index rose 1.09% to 103.41, a 19-month high, while the US 10-year closed at 5.154% and the Australia-US two-year spread collapsed to about 3 basis points from 36. EURUSD fell 1.59% to 1.1024, USDJPY rose 1.51% to 159.78 and AUDUSD fell 1.79% to 0.6764, a 10-month low. Three FX regimes — the broad dollar, the US rate level and the Australian carry premium — flipped in the same week. This report marks the thresholds, ranks which one can flip back first, and lists the week's calendar.
Author  Irene Q.
22 hours ago
The dollar index rose 1.09% to 103.41, a 19-month high, while the US 10-year closed at 5.154% and the Australia-US two-year spread collapsed to about 3 basis points from 36. EURUSD fell 1.59% to 1.1024, USDJPY rose 1.51% to 159.78 and AUDUSD fell 1.79% to 0.6764, a 10-month low. Three FX regimes — the broad dollar, the US rate level and the Australian carry premium — flipped in the same week. This report marks the thresholds, ranks which one can flip back first, and lists the week's calendar.
Related Instrument
goTop
quote