

WTI (USOIL) Is down 2.01% on Oct 26: What You Need to Watch

Source Tradingkey

WTI (USOIL) is down 2.01% at Oct 26 21:25(ET), now at $101.11, with a 7-day up of 2.99%.
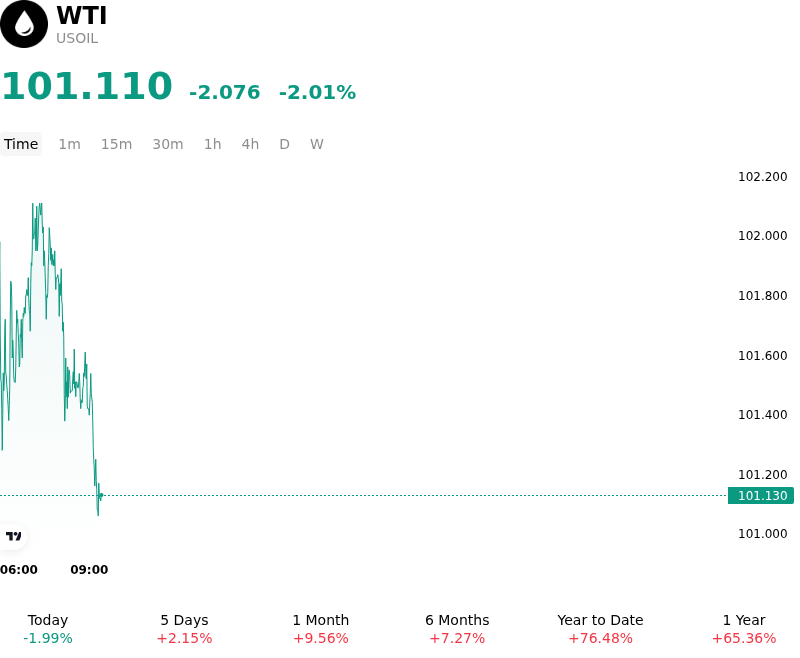
SummaryOverview

What is driving WTI (USOIL)’s stock price down today?

West Texas Intermediate crude oil experienced a downward retracement as market participants engaged in profit-taking following a strong multi-session rally. The sell-off was primarily driven by a partial unwinding of the geopolitical risk premium that had previously built up amid escalating Middle East tensions involving the United States, Israel, and Iran. Although geopolitical headlines continued to keep energy markets on edge, the lack of immediate, direct disruptions to physical crude infrastructure or maritime shipping lanes through the Strait of Hormuz prompted institutional investors to take profits and liquidate tactical long positions.

From a fundamental supply and demand perspective, the physical crude market continues to demonstrate near-term balance. Global crude production outside OPEC+ remains robust, providing a buffer against prospective regional supply shocks. While market participants remain sensitive to potential military developments, current physical oil flows continue to reach international refiners without operational interruptions. The absence of tangible supply losses has capped immediate upside momentum, shifting focus back toward broader physical balance metrics and inventory trajectory.

Macroeconomic conditions and currency fluctuations also contributed to the downward pressure on crude prices. A resilient U.S. dollar made dollar-denominated commodities relatively more expensive for international buyers, dampening prompt import interest. Simultaneously, broader financial market caution regarding global industrial activity and central bank policy pathways served as a headwind for energy demand expectations. Institutional capital flows reflected this shift, as systematic funds adjusted leverage to mitigate risk amid heightened price volatility.

Overall, the decline in oil prices reflects a temporary, event-driven repricing rather than a fundamental structural breakdown in global energy fundamentals. The market remains caught between supportive supply-side geopolitical risk premiums and counterbalancing macroeconomic demand concerns. Institutional traders will continue to closely monitor Middle East security developments, upcoming U.S. inventory reports, and OPEC+ policy signals for clarity on the next directional catalyst.

Technical Analysis of WTI (USOIL)

Technically, WTI (USOIL) shows a MACD (12,26,9) value of 1.684, indicating a buy signal. The RSI at 63.158 suggests neutral condition and the Williams %R at 15.602 suggests overbought condition. Please monitor closely.
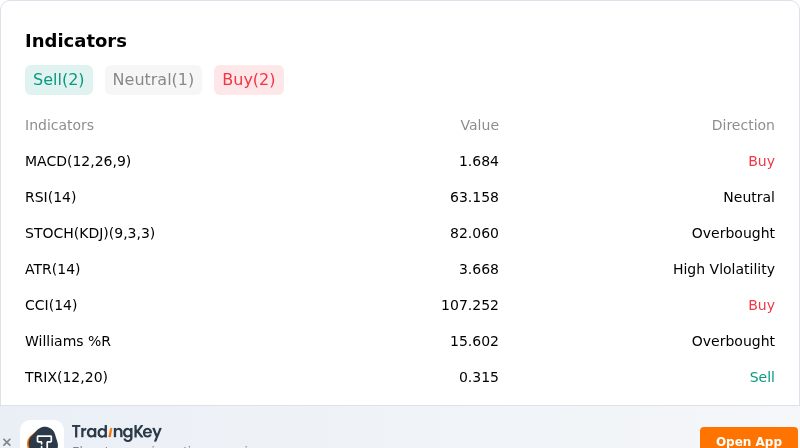
IndicatorAnalysis

More details about WTI (USOIL)

Recent Events and Risks:

  • Geopolitical Risk Premium De-escalation: News surrounding potential diplomatic mediation and temporary lulls in maritime security threats have prompted immediate profit-taking, causing traders to unwind accumulated geopolitical risk premiums and driving WTI futures lower from multi-month highs.
  • US Sanctions Waivers and Fleet Regulatory Relief: Policy shifts and executive actions waiving sanctions on energy exports alongside proposed regulatory relief for oil tankers threaten to expand effective seaborne crude transport capacity, applying downward pressure to futures prices.
  • IEA Demand Growth Downgrades: Major international energy agencies and institutional strategists have downgraded global oil consumption forecasts, citing persistent macroeconomic headwinds and high fuel costs that are driving demand destruction across key industrial sectors.
  • Technical Overhead Resistance and Long Position Unwinding: Futures encountered sharp technical resistance near psychological threshold levels, triggering automated stop-loss selling and position unwinding as momentum indicators reached overbought territory.
Disclaimer: For information purposes only. Past performance is not indicative of future results.
placeholder
Dollar presses 102 as the 10-year yield sits at 5.14% — and October hike odds are only 17%The dollar index closed at 101.99 (+0.20%) on Monday after briefly topping 102.07, while the 10-year Treasury yield rose to 5.14% and the 2-year hit 4.774% — yet futures price only about a 17% chance of a hike at the October 27-28 FOMC, versus roughly 90% for December. The driver is a global bond selloff, not a Fed repricing: France's 10-year OAT jumped to 4.84% ~ 4.94% and the OAT-Bund spread widened to 140 ~ 146bp. Here are the levels, the cross-asset read-through and what to watch.
Author  Irene Q.
Oct 20, Tue
The dollar index closed at 101.99 (+0.20%) on Monday after briefly topping 102.07, while the 10-year Treasury yield rose to 5.14% and the 2-year hit 4.774% — yet futures price only about a 17% chance of a hike at the October 27-28 FOMC, versus roughly 90% for December. The driver is a global bond selloff, not a Fed repricing: France's 10-year OAT jumped to 4.84% ~ 4.94% and the OAT-Bund spread widened to 140 ~ 146bp. Here are the levels, the cross-asset read-through and what to watch.
placeholder
The Fed will sit still on October 28 — but 100 of 100 economists now expect a December hikeA Reuters poll run October 16-20 found 94 of 100 economists expecting the Fed to hold at 3.75-4.00% on October 28 — and all 100 expecting a hike in December, against less than half a month earlier. The market is close to the same price, with CME FedWatch at roughly 17% for October and 82.8% for December. With the Fed in blackout since October 17, here are the five dates that decide the rest of the year, what each one is priced for, and the two directions each can take.
Author  Irene Q.
Oct 22, Thu
A Reuters poll run October 16-20 found 94 of 100 economists expecting the Fed to hold at 3.75-4.00% on October 28 — and all 100 expecting a hike in December, against less than half a month earlier. The market is close to the same price, with CME FedWatch at roughly 17% for October and 82.8% for December. With the Fed in blackout since October 17, here are the five dates that decide the rest of the year, what each one is priced for, and the two directions each can take.
placeholder
Gold Price Analysis Today | Forex Gold Analysis | XAU/USD Analysis - October 23, 2026Get the latest gold price analysis, forex gold insights, and XAU/USD analysis for October 23, 2026. Read on for the details.
Author  Mitrade
Oct 23, Fri
Get the latest gold price analysis, forex gold insights, and XAU/USD analysis for October 23, 2026. Read on for the details.
placeholder
Nasdaq closes at 26,008.86 — 8.9 points above 26,000, and the credit market never blinkedThe Nasdaq Composite fell 2.60% to 26,008.86 on October 22, its worst session since June, as Meta sank 6.98% on 2026 capex guidance of $135–145 billion. But the equal-weight S&P 500 rose 0.73%, high-yield credit was flat and 10-year yields fell 20 basis points. This was an AI de-rating, not a risk-off event — here is the transmission chain, the 29,000 / 28,200 levels and what would prove it wrong.
Author  Irene Q.
Oct 23, Fri
The Nasdaq Composite fell 2.60% to 26,008.86 on October 22, its worst session since June, as Meta sank 6.98% on 2026 capex guidance of $135–145 billion. But the equal-weight S&P 500 rose 0.73%, high-yield credit was flat and 10-year yields fell 20 basis points. This was an AI de-rating, not a risk-off event — here is the transmission chain, the 29,000 / 28,200 levels and what would prove it wrong.
placeholder
Brent tops $113 on Saudi supply risk — but the diesel line in the EIA report is the tellBrent's December contract settled at $113.17 on October 22, up 4.00% and the highest close since May 4, after Saudi Arabia restricted refined-product shipments. The same session's EIA report showed crude stocks down 3.06 million barrels and gasoline down 2.95 million — but distillates built 1.68 million. That single line decides whether $113 holds: here are the data, the 108.8 / 114.0 / 119.3 levels and the two scenarios.
Author  Irene Q.
Oct 23, Fri
Brent's December contract settled at $113.17 on October 22, up 4.00% and the highest close since May 4, after Saudi Arabia restricted refined-product shipments. The same session's EIA report showed crude stocks down 3.06 million barrels and gasoline down 2.95 million — but distillates built 1.68 million. That single line decides whether $113 holds: here are the data, the 108.8 / 114.0 / 119.3 levels and the two scenarios.
goTop
quote