

Amazon.com Inc Stock (AMZN) Opened Down by 3.50% on Oct 22: Facts Behind the Movement

Source Tradingkey

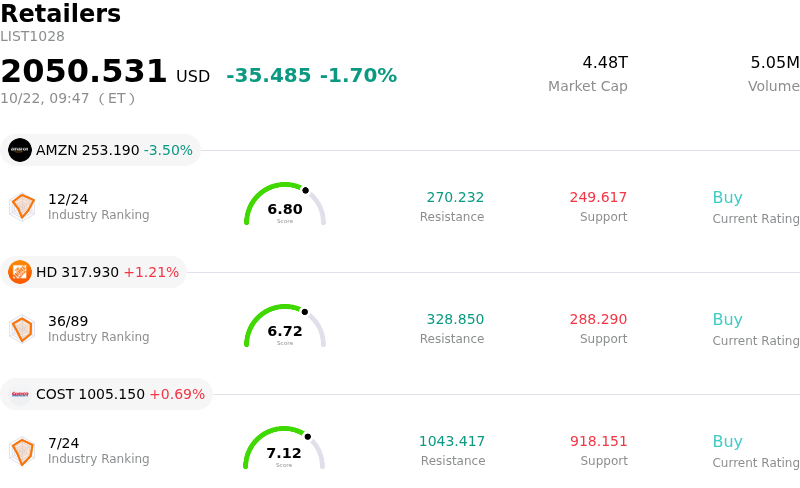
Amazon.com Inc (AMZN) opened down by 3.50%. The Retailers sector is down by 1.70%. The company underperformed the industry. Top 3 stocks by turnover in the sector: Amazon.com Inc (AMZN) down 3.50%; Home Depot Inc (HD) up 1.21%; Costco Wholesale Corp (COST) up 0.69%.
SummaryOverview

What is driving Amazon.com Inc (AMZN)’s stock price down today?

Amazon experienced a notable downward pull driven primarily by pre-earnings positioning, heightened scrutiny over capital expenditure, and profit-taking following recent gains. As the company approaches its third-quarter earnings release, market participants are exercising caution amidst ongoing debates over the profitability of heavy artificial intelligence infrastructure spending. Recent updates highlighting a massive annual capital expenditure projection have intensified worries regarding free cash flow compression, overshadowing optimistic long-term growth prospects for cloud computing.

Sector-wide volatility across mega-cap technology equities also exacerbated selling pressure. Investors remain sensitive to valuation metrics and the timing of returns on generative artificial intelligence investments. Although cloud revenue and backlog trends remain strong, market sentiment has been weighed down by guidance reflecting softer top-line momentum, partly due to calendar shifts in key promotional events earlier in the year.

Institutional portfolio adjustments ahead of earnings contributed to intraday volatility as fund managers rebalanced positions to manage risk. While analyst sentiment remains broadly positive regarding long-term core operations and advertising growth, short-term uncertainty surrounding margin dynamics and elevated data center buildout costs continues to anchor investor caution in the immediate term.

Technical Analysis of Amazon.com Inc (AMZN)

Technically, Amazon.com Inc (AMZN) shows a MACD (12,26,9) value of 1.014, indicating a buy signal. The RSI at 48.986 suggests neutral condition and the Williams %R at 62.366 suggests sell condition. Please monitor closely.

Media Coverage of Amazon.com Inc (AMZN)

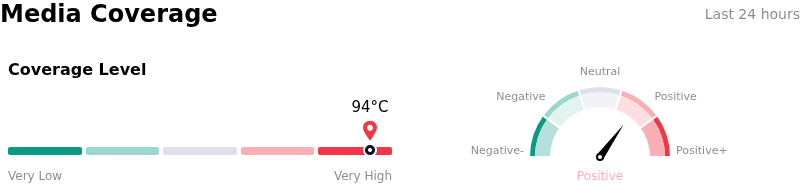
In terms of media coverage, Amazon.com Inc (AMZN) shows a coverage score of 94, indicating a very high level of media attention. The overall market sentiment index is currently in bullish zone.
SentimentAnalysis

Fundamental Analysis of Amazon.com Inc (AMZN)

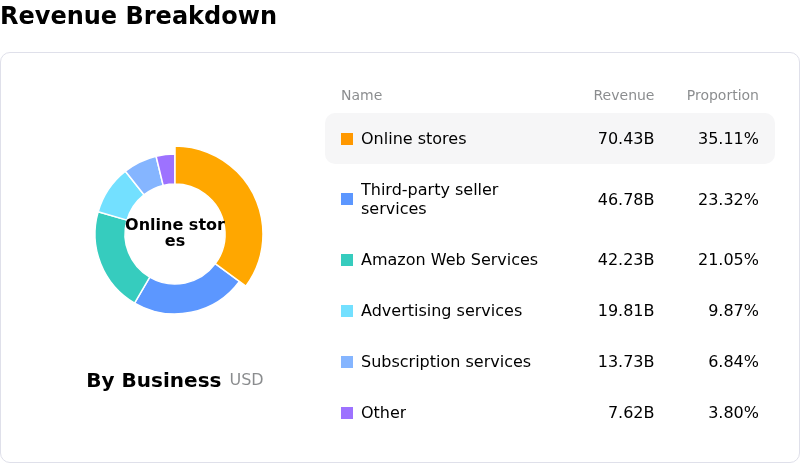
Amazon.com Inc (AMZN) is in the Retailers industry. Its latest annual revenue is $716.92B, ranking 1 in the industry. The net profit is $77.67B, ranking 1 in the industry. Company Profile
FundamentalAnalysis

Over the past month, multiple analysts have rated the company as Buy, with an average price target of $323.86, a high of $405.00, and a low of $207.00.

More details about Amazon.com Inc (AMZN)

Company Specific Risks:

  • Escalating Capital Expenditure and Cash Flow Strains: Amazon's projected $220 billion capital expenditure budget for AI infrastructure has pushed trailing twelve-month free cash flow into negative territory at -$7.6 billion, raising institutional concern over cash burn and capital efficiency.
  • FTC Antitrust Lawsuit Targeting Advertising Operations: A lawsuit filed by the FTC and 22 states alleges Amazon overcharged advertisers by more than $20 billion through hidden auction pricing, creating legal uncertainty and financial risk for its high-margin advertising segment.
  • Impending Core Marketplace Trial and Regulatory Liability: Heightened federal scrutiny, including an FTC trial targeting marketplace pricing policies and growing regulatory liability regarding third-party products, threatens retail business margins.
  • Sequential Retail Guidance Softness: Management's revenue guidance of $197 billion to $202 billion reflected underlying deceleration in e-commerce growth and foreign exchange headwinds, increasing stock volatility ahead of earnings.
Disclaimer: For information purposes only. Past performance is not indicative of future results.
placeholder
Dollar presses 102 as the 10-year yield sits at 5.14% — and October hike odds are only 17%The dollar index closed at 101.99 (+0.20%) on Monday after briefly topping 102.07, while the 10-year Treasury yield rose to 5.14% and the 2-year hit 4.774% — yet futures price only about a 17% chance of a hike at the October 27-28 FOMC, versus roughly 90% for December. The driver is a global bond selloff, not a Fed repricing: France's 10-year OAT jumped to 4.84% ~ 4.94% and the OAT-Bund spread widened to 140 ~ 146bp. Here are the levels, the cross-asset read-through and what to watch.
Author  Irene Q.
Oct 20, Tue
The dollar index closed at 101.99 (+0.20%) on Monday after briefly topping 102.07, while the 10-year Treasury yield rose to 5.14% and the 2-year hit 4.774% — yet futures price only about a 17% chance of a hike at the October 27-28 FOMC, versus roughly 90% for December. The driver is a global bond selloff, not a Fed repricing: France's 10-year OAT jumped to 4.84% ~ 4.94% and the OAT-Bund spread widened to 140 ~ 146bp. Here are the levels, the cross-asset read-through and what to watch.
placeholder
Meta's AI bill just hit $145 billion — and it issued a new share class to pay for itMeta reported record third-quarter revenue of $64.60 billion, up 26% from a year earlier, and raised full-year 2026 capital expenditure guidance to $135-145 billion from $130-145 billion. To fund that build-out without touching Mark Zuckerberg's voting control, the company announced a 2-for-1 stock split that hands every Class A holder a new non-voting Class C share. Here are the four lines that matter, the peer group that is being re-rated alongside it, and the bull and bear cases.
Author  Irene Q.
Oct 22, Thu
Meta reported record third-quarter revenue of $64.60 billion, up 26% from a year earlier, and raised full-year 2026 capital expenditure guidance to $135-145 billion from $130-145 billion. To fund that build-out without touching Mark Zuckerberg's voting control, the company announced a 2-for-1 stock split that hands every Class A holder a new non-voting Class C share. Here are the four lines that matter, the peer group that is being re-rated alongside it, and the bull and bear cases.
placeholder
The Fed will sit still on October 28 — but 100 of 100 economists now expect a December hikeA Reuters poll run October 16-20 found 94 of 100 economists expecting the Fed to hold at 3.75-4.00% on October 28 — and all 100 expecting a hike in December, against less than half a month earlier. The market is close to the same price, with CME FedWatch at roughly 17% for October and 82.8% for December. With the Fed in blackout since October 17, here are the five dates that decide the rest of the year, what each one is priced for, and the two directions each can take.
Author  Irene Q.
Oct 22, Thu
A Reuters poll run October 16-20 found 94 of 100 economists expecting the Fed to hold at 3.75-4.00% on October 28 — and all 100 expecting a hike in December, against less than half a month earlier. The market is close to the same price, with CME FedWatch at roughly 17% for October and 82.8% for December. With the Fed in blackout since October 17, here are the five dates that decide the rest of the year, what each one is priced for, and the two directions each can take.
placeholder
Gold Price Analysis Today | Forex Gold Analysis | XAU/USD Analysis - October 23, 2026Get the latest gold price analysis, forex gold insights, and XAU/USD analysis for October 23, 2026. Read on for the details.
Author  Mitrade
Yesterday 02: 56
Get the latest gold price analysis, forex gold insights, and XAU/USD analysis for October 23, 2026. Read on for the details.
placeholder
Nasdaq closes at 26,008.86 — 8.9 points above 26,000, and the credit market never blinkedThe Nasdaq Composite fell 2.60% to 26,008.86 on October 22, its worst session since June, as Meta sank 6.98% on 2026 capex guidance of $135–145 billion. But the equal-weight S&P 500 rose 0.73%, high-yield credit was flat and 10-year yields fell 20 basis points. This was an AI de-rating, not a risk-off event — here is the transmission chain, the 29,000 / 28,200 levels and what would prove it wrong.
Author  Irene Q.
Yesterday 06: 39
The Nasdaq Composite fell 2.60% to 26,008.86 on October 22, its worst session since June, as Meta sank 6.98% on 2026 capex guidance of $135–145 billion. But the equal-weight S&P 500 rose 0.73%, high-yield credit was flat and 10-year yields fell 20 basis points. This was an AI de-rating, not a risk-off event — here is the transmission chain, the 29,000 / 28,200 levels and what would prove it wrong.
goTop
quote