


AT&T Inc Stock (T) Moved Down by 5.70% on Oct 21: What Investors Need To Know
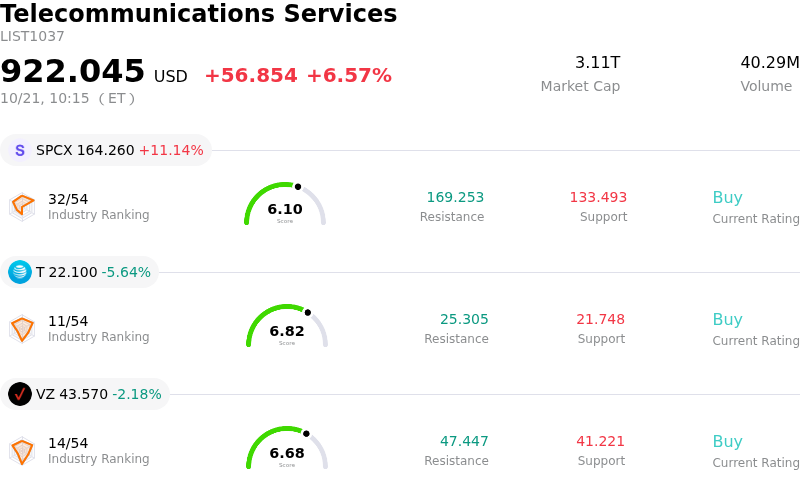
AT&T Inc (T) moved down by 5.70%. The Telecommunications Services sector is up by 6.57%. The company underperformed the industry. Top 3 stocks by turnover in the sector: SpaceX (SPCX) up 10.99%; AT&T Inc (T) down 5.64%; Verizon Communications Inc (VZ) down 2.20%.
What is driving AT&T Inc (T)’s stock price down today?
AT&T experienced a notable downside move as market participants digested the company's third-quarter financial results. Although top-line revenues and adjusted earnings per share surpassed Wall Street consensus estimates, driven by solid expansion in fiber and converged broadband services, investors responded negatively to underlying complexities in the report and unfulfilled expectations in key operational metrics. Management raised its full-year adjusted earnings guidance, but the positive headline figures were overshadowed by lower-than-anticipated reported GAAP earnings.
A primary driver of the downward momentum was the sharp divergence between adjusted and GAAP performance. The company recorded substantial non-cash impairment charges related to its held-for-sale international wireless business in Mexico, alongside restructuring and employee separation costs. This resulted in a steep decline in reported net income compared to the prior-year period, weighing heavily on investor confidence despite operational momentum in core domestic service revenues.
Subscriber growth metrics also contributed to the cautious market reaction. While broadband and fiber net additions maintained solid momentum, postpaid phone subscriber net additions fell short of optimistic consensus expectations and failed to deliver an upside surprise. In an increasingly saturated U.S. telecommunications landscape, modest wireless subscriber gains reinforced concerns over aggressive rival promotions, pricing power, and customer retention dynamics.
Capital allocation and long-term spending priorities further constrained share price performance. Although the company reiterated its multi-year free cash flow targets and outlined lower long-term capital intensity plans, the lack of an upward revision to near-term cash flow expectations left institutional investors seeking stronger balance-sheet deleveraging momentum. Additionally, broader market anxiety regarding emerging satellite direct-to-cell technology and potential long-term competition in mobile connectivity continued to serve as a sentiment overhang for traditional wireless carriers.
Technical Analysis of AT&T Inc (T)
Technically, AT&T Inc (T) shows a MACD (12,26,9) value of -0.172, indicating a sell signal. The RSI at 33.656 suggests neutral condition and the Williams %R at 92.504 suggests oversold condition. Please monitor closely.
Media Coverage of AT&T Inc (T)
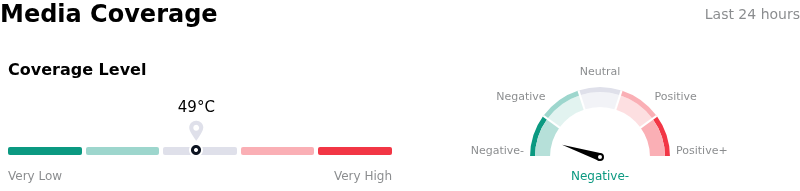
In terms of media coverage, AT&T Inc (T) shows a coverage score of 49, indicating a moderate level of media attention. The overall market sentiment index is currently in extremely bearish zone.
Fundamental Analysis of AT&T Inc (T)
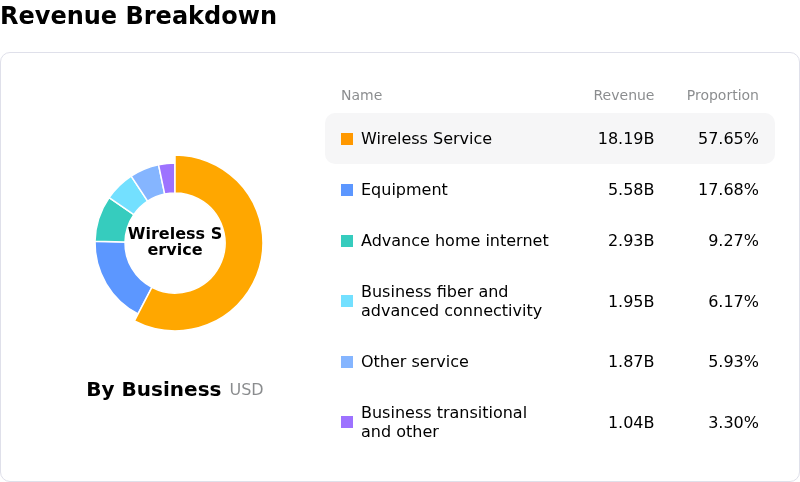
AT&T Inc (T) is in the Telecommunications Services industry. Its latest annual revenue is $125.65B, ranking 2 in the industry. The net profit is $21.89B, ranking 1 in the industry. Company Profile
Over the past month, multiple analysts have rated the company as Buy, with an average price target of $28.50, a high of $36.00, and a low of $20.00.
More details about AT&T Inc (T)
Company Specific Risks:
- Postpaid Subscriber Growth Shortfall: AT&T added 379,000 net postpaid phone subscribers in Q3 2026, missing institutional consensus estimates of 387,410 and sparking concerns over core wireless customer acquisition velocity.
- Mexico Wireless Impairment and GAAP Profit Collapse: Reported GAAP diluted earnings per share dropped sharply to $0.13, heavily impacted by a $2.6 billion non-cash impairment charge associated with its held-for-sale Mexico wireless operations and employee separation expenses.
- Elevated Financial Leverage and Debt Burden: Market sentiment turned negative regarding balance sheet leverage as net debt rose following a $23 billion spectrum acquisition from EchoStar, pushing the net debt-to-adjusted EBITDA ratio up to 3.13 times.
- Anticipated Q4 Operating Margin Headwinds: Management warned that fourth-quarter operational performance faces cost pressures from heightened marketing and customer retention spending amid intensifying wireless sector competition and prospective alternative network entry.
Recommended Articles


