


HDFC Bank Ltd Stock (HDB) Moved Down by 3.61% on Oct 19: What Signal Does It Send?
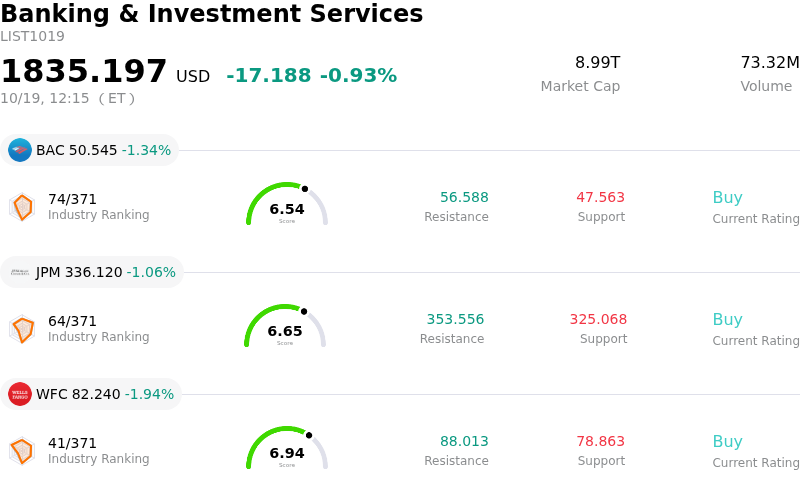
HDFC Bank Ltd (HDB) moved down by 3.61%. The Banking & Investment Services sector is down by 0.93%. The company underperformed the industry. Top 3 stocks by turnover in the sector: Bank of America Corp (BAC) down 1.32%; JPMorgan Chase & Co (JPM) down 1.06%; Wells Fargo & Co (WFC) down 1.94%.
What is driving HDFC Bank Ltd (HDB)’s stock price down today?
HDFC Bank Limited ADRs faced downward pressure and heightened intraday volatility following the release of the bank's second-quarter financial results. Although core net interest income and credit demand across retail and commercial segments remained healthy, overall net profit growth narrowly missed consensus analyst expectations. The earnings drag was primarily driven by a pullback in non-interest treasury trading gains alongside elevated operating expenditures and provisioning. Crucially, sequential compression in net interest margins highlighted persistent deposit pricing headwinds, as the lender continues to navigate competitive liquidity conditions and elevated funding costs across the domestic market.
Market sentiment was further tempered by operational and leadership considerations. Management outlined balance sheet recalibration plans aimed at boosting core retail deposits and reducing reliance on higher-cost wholesale funding. However, details regarding executive leadership transitions introduced temporary uncertainty surrounding strategy execution, cost structure optimization, and the exact timeline for margin trough recovery. Institutional investors evaluated these structural adjustments against near-term return metrics, triggering defensive portfolio rebalancing.
Exogenous headwinds also contributed to the negative price momentum during the US trading session. Headlines regarding upcoming lead plaintiff deadlines in shareholder class-action litigation against the institution added incremental friction to market sentiment. Combined with broader macroeconomic caution surrounding interest rate trajectories and currency movements in emerging market financials, these factors fueled active selling and intraday volatility in the ADR listing.
Technical Analysis of HDFC Bank Ltd (HDB)
Technically, HDFC Bank Ltd (HDB) shows a MACD (12,26,9) value of 0.264, indicating a neutral signal. The RSI at 51.297 suggests neutral condition and the Williams %R at 45.633 suggests neutral condition. Please monitor closely.
Fundamental Analysis of HDFC Bank Ltd (HDB)
HDFC Bank Ltd (HDB) is in the Banking & Investment Services industry. Its latest annual revenue is $28.09B, ranking 17 in the industry. The net profit is $7.98B, ranking 14 in the industry. Company Profile
Over the past month, multiple analysts have rated the company as Buy, with an average price target of $30.77, a high of $35.00, and a low of $26.10.
More details about HDFC Bank Ltd (HDB)
Company Specific Risks:
- Net Interest Margin Compression and Funding Pressures: Following recent quarterly disclosures, HDFC Bank reported a margin compression down to 3.32% due to lagged deposit repricing, rising liability costs, and continued reliance on wholesale funding to maintain liquidity balance.
- U.S. Securities Class Action Lawsuit Exposure: Ongoing legal scrutiny from a U.S. securities class action lawsuit targeting HDFC Bank equity purchases made between 2023 and 2026 continues to weigh on sentiment, posing potential financial liabilities and reputational risk.
- Executive Leadership Transition & Execution Risks: Market uncertainty persists over the executive succession plan following the announced departure of CEO Sashidhar Jagdishan, raising concerns regarding potential strategic shifts, corporate memory loss, and operational disruption under new leadership.
- Weak Retail Lending Accretion & Post-Earnings Selling: Intraday price pressure follows market disappointment over Q2 FY27 results, with institutional analysts pointing to lagging retail loan expansion and mixed operational metrics relative to rising cost-of-funds burdens.
Recommended Articles


