


Palantir Technologies Inc Stock (PLTR) Moved Down by 5.74% on Oct 16: What Investors Need To Know
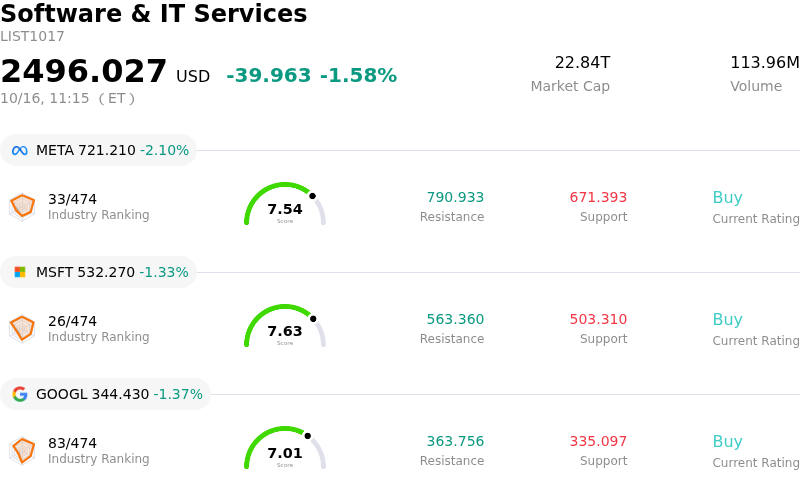
Palantir Technologies Inc (PLTR) moved down by 5.74%. The Software & IT Services sector is down by 1.58%. The company underperformed the industry. Top 3 stocks by turnover in the sector: Meta Platforms Inc (META) down 2.10%; Microsoft Corp (MSFT) down 1.33%; Alphabet Inc Class A (GOOGL) down 1.37%.
What is driving Palantir Technologies Inc (PLTR)’s stock price down today?
Palantir Technologies experienced a notable intraday pullback today, primarily driven by broad institutional profit-taking and short-term valuation recalibration following an extended multi-month rally. The enterprise software provider has seen robust upward momentum in recent months, fueled by accelerating enterprise adoption of its Artificial Intelligence Platform, sovereign AI initiatives, and expanding commercial customer wins. However, this prolonged price appreciation pushed forward valuation metrics to elevated levels, leaving the equity increasingly sensitive to momentum unwinding and profit-taking by institutional asset managers.
Positioning ahead of the company's upcoming third-quarter earnings report has also contributed to the downside momentum. Market participants are exercising heightened caution as expectations for quarterly top-line growth and margin expansion remain exceptionally high. With a demanding benchmark set for operational execution, institutional investors are electing to lock in gains and reduce position sizing to mitigate potential volatility around the quarterly release. Additionally, recent routine insider share sales executed under pre-arranged trading plans have slightly dampened retail sentiment, reinforcing a cautious trading tone across the market.
Broader technology sector dynamics and macroeconomic backdrop have further amplified the stock's movement. High-growth software companies operating at premium valuation multiples remain vulnerable to sector-wide multiple compression, particularly during periods of interest rate uncertainty and broader equity market consolidation. While Palantir maintains solid balance sheet strength, strong free cash flow, and accelerating commercial momentum, short-term equity performance is being dictated by macro risk management and pre-earnings de-risking. Long-term institutional focus will remain on the upcoming financial disclosures to assess the sustainability of enterprise AI monetization and commercial deal velocity.
Technical Analysis of Palantir Technologies Inc (PLTR)
Technically, Palantir Technologies Inc (PLTR) shows a MACD (12,26,9) value of -1.283, indicating a neutral signal. The RSI at 48.756 suggests neutral condition and the Williams %R at 85.603 suggests oversold condition. Please monitor closely.
Media Coverage of Palantir Technologies Inc (PLTR)
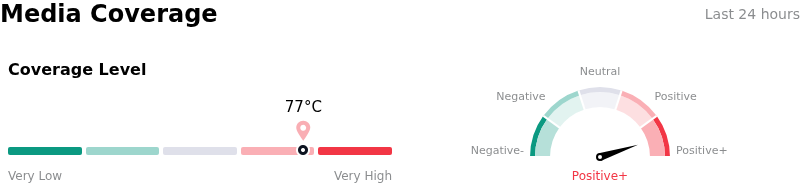
In terms of media coverage, Palantir Technologies Inc (PLTR) shows a coverage score of 77, indicating a high level of media attention. The overall market sentiment index is currently in extremely bullish zone.
Fundamental Analysis of Palantir Technologies Inc (PLTR)
Palantir Technologies Inc (PLTR) is in the Software & IT Services industry. Its latest annual revenue is $4.48B, ranking 72 in the industry. The net profit is $1.63B, ranking 31 in the industry. Company Profile
Over the past month, multiple analysts have rated the company as Buy, with an average price target of $207.13, a high of $265.00, and a low of $80.00.
More details about Palantir Technologies Inc (PLTR)
Company Specific Risks:
- Severe Valuation Multiple Stretch: Palantir trades at an extreme trailing price-to-earnings ratio of over 167x and a forward P/E exceeding 84x, leaving zero margin for error ahead of its upcoming Q3 earnings report and exposing the stock to aggressive multiple compression if execution stumbles.
- Analyst Downgrades on Multiple-Driven Rally: Recent analyst downgrades to Hold highlight that the stock's ~35% price surge over recent weeks was powered primarily by multiple expansion rather than operational forecast revisions, raising risks of sharp post-earnings drawdowns.
- Projected Top-Line Growth Deceleration: Wall Street projections anticipate quarterly revenue growth stepping down from 93% in Q2 to 84% in Q3 and 75% in Q4, with medium-term growth moderating toward 50%, creating headwinds for a stock priced for persistent hyper-growth.
- Insider Share Sales and Dilution via Stock-Based Compensation: Heavy insider share liquidations alongside a 66% year-over-year increase in stock-based compensation to $265.2 million continue to expand total outstanding shares, creating overhead selling pressure during periods of elevated volatility.
Recommended Articles


