


Ethereum (ETHUSD) Is up 1.09% on Oct 12: Key Drivers to Watch
Ethereum (ETHUSD) is up 1.09% at Oct 12 00:45(ET), now at $2563.4, with a 7-day down of 5.41%.
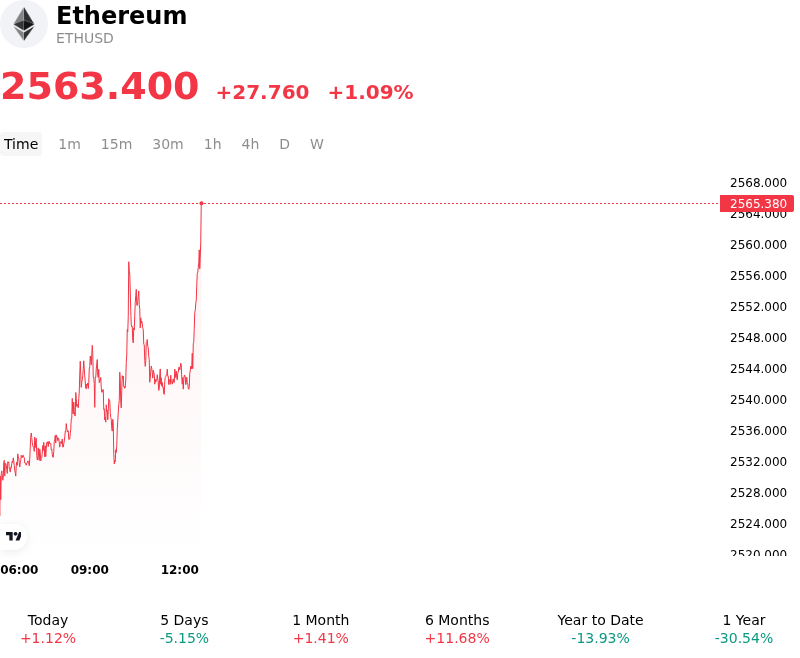
What is driving Ethereum (ETHUSD)’s stock price up today?
Ethereum experienced upward momentum as strong dip-buying activity from institutional holders and whale addresses absorbed recent sell-side pressure, prompting a wave of short-covering across crypto derivatives venues. Following a period of consolidation near key support levels, aggressive spot accumulation tightened order-book liquidity, forcing leveraged short positions to unwind as perpetual futures funding rates normalized. The stabilization in spot prices was further bolstered by steady network utilization and a persistent trend of low exchange inventory, which reduced overhead liquid supply and amplified price responsiveness to capital inflows.
Fundamental catalysts within the Ethereum ecosystem also supported investor sentiment. Progress surrounding protocol developments, including testnet advances for the Glamsterdam upgrade aimed at optimizing Layer-1 execution and transaction efficiency, strengthened medium-term structural expectations. Concurrently, institutional interest remains grounded in structural tailwinds, such as staking yields and the expanding integration of tokenized real-world assets within decentralized finance protocols. Even as spot Ethereum ETF flows navigate temporary spot-market resistance, baseline institutional demand continues to provide underlying support.
On the macroeconomic front, a brief stabilization in benchmark Treasury yields and shifting Federal Reserve monetary policy expectations relieved pressure on risk-sensitive digital assets. Softer US dollar dynamics helped foster broader risk-on sentiment, encouraging capital to re-enter high-beta crypto assets. Despite today's recovery, institutional investors continue to monitor macro liquidity conditions, leverage risks in derivatives markets, and spot ETF flow stability as key factors influencing medium-term price trajectory.
Technical Analysis of Ethereum (ETHUSD)
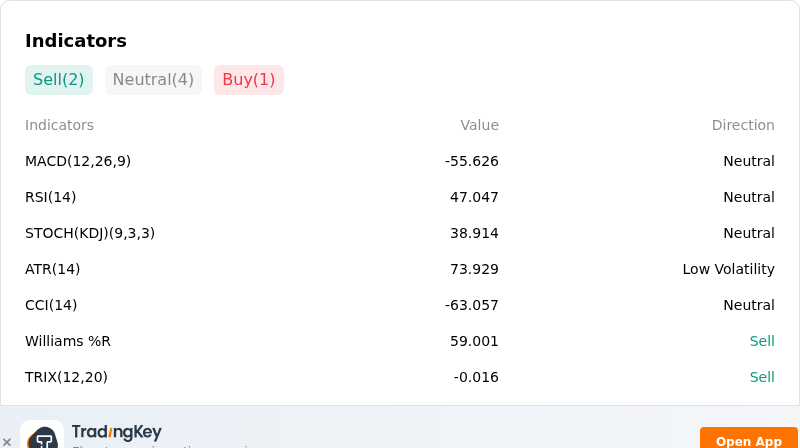
Technically, Ethereum (ETHUSD) shows a MACD (12,26,9) value of -55.626, indicating a neutral signal. The RSI at 47.047 suggests neutral condition and the Williams %R at 59.001 suggests sell condition. Please monitor closely.
More details about Ethereum (ETHUSD)
Recent Events and Risks:
- Persistent Spot ETF Outflows: U.S. spot Ethereum ETFs recorded nine consecutive sessions of net withdrawals totaling roughly $697 million, highlighting sustained institutional capital exit and removing a primary spot market demand tailwind.
- Massive Long Liquidation Cascades: The recent price slide below key support triggered over $220 million in long liquidations in a 24-hour window, leaving an estimated $1.35 billion in leveraged long positions vulnerable to forced unwind, particularly around a dense $2,511 liquidation cluster.
- Macro Hedging and Treasury Yield Pressure: Elevated 10-year U.S. Treasury yields near 5.3% and a firming U.S. Dollar Index have suppressed global risk-asset liquidity premiums, compounding risk-off equity selloffs and pressuring high-beta digital assets like ETH.
- Technical Support Breakdown: Ether's loss of key technical support at $2,630 and brief breach beneath $2,500 has exposed lower support levels near $2,400–$2,350, supported by cooling momentum indicators including a deeply negative MACD.
Recommended Articles


