

Bitcoin shows bottoming signs despite recent macro pressures

Source Fxstreet
  • Bitcoin trades above $82,000 as macro pressures weigh on spot sentiment despite improving derivatives conditions.
  • CryptoQuant's contributor pointed to low exchange reserves, recovering apparent demand and whale holdings near 3 million BTC as potential bottoming signals.
  • Bitcoin spot ETF inflows and stronger US demand remain key to establish price bottom.

Bitcoin (BTC) remained range-bound above $82,000 on Monday as upcoming US economic data and onchain indicators weigh on market sentiment.

Bitcoin holds above $82,000 as traders await inflation data

Crypto trading firm QCP Group stated in its Monday report that Bitcoin has maintained a firmer footing a year after the market’s largest single-day liquidation event.

The report noted that the feared repeat of last year’s October 10 sell-off did not materialize despite renewed concerns over sizable BTC transfers by the US government and reports of several Ledger wallet compromises over the weekend.

Despite that, QCP noted that spot market performance has yet to match expectations for a strong October rally, but derivatives indicators suggest traders are positioning for a potential breakout.

The report highlighted a sizable $90,000/$95,000/$100,000 October 30 call butterfly, which represents one of the largest concentrations of open interest for the end of the month.

Macroeconomic developments could determine whether Bitcoin breaks above its current range or faces renewed selling pressure. QCP identified US Consumer Price Index (CPI) data on Wednesday and Producer Price Index (PPI) data on Thursday as key events to watch this week.

Federal Reserve (Fed) Chair Warsh is also scheduled to speak at the IMF-World Bank Annual meetings on Friday. QCP noted that a repeat of his hawkish remarks at Jackson Hole could pressure market sentiment.

Onchain data signals potential bottom

Conversely, CryptoQuant contributor XWIN Japan identified early signs that Bitcoin could be approaching a market bottom in October, ahead of the US midterm elections on November 3.

In a report on Monday, XWIN argued that several factors have left Bitcoin vulnerable to further declines, including elevated US Treasury yields, high Oil prices, outflows in spot Bitcoin exchange-traded funds (ETFs) and profit-taking. These conditions increased the risk of leveraged liquidations before a sustained recovery could take hold.

However, the contributor highlighted three onchain indicators suggesting that selling pressure could be easing.

First, Bitcoin reserves on crypto exchanges remain low despite a recent rebound. Lower exchange reserves can indicate that fewer BTC are readily available for immediate selling, although the metric alone does not confirm reduced selling pressure.
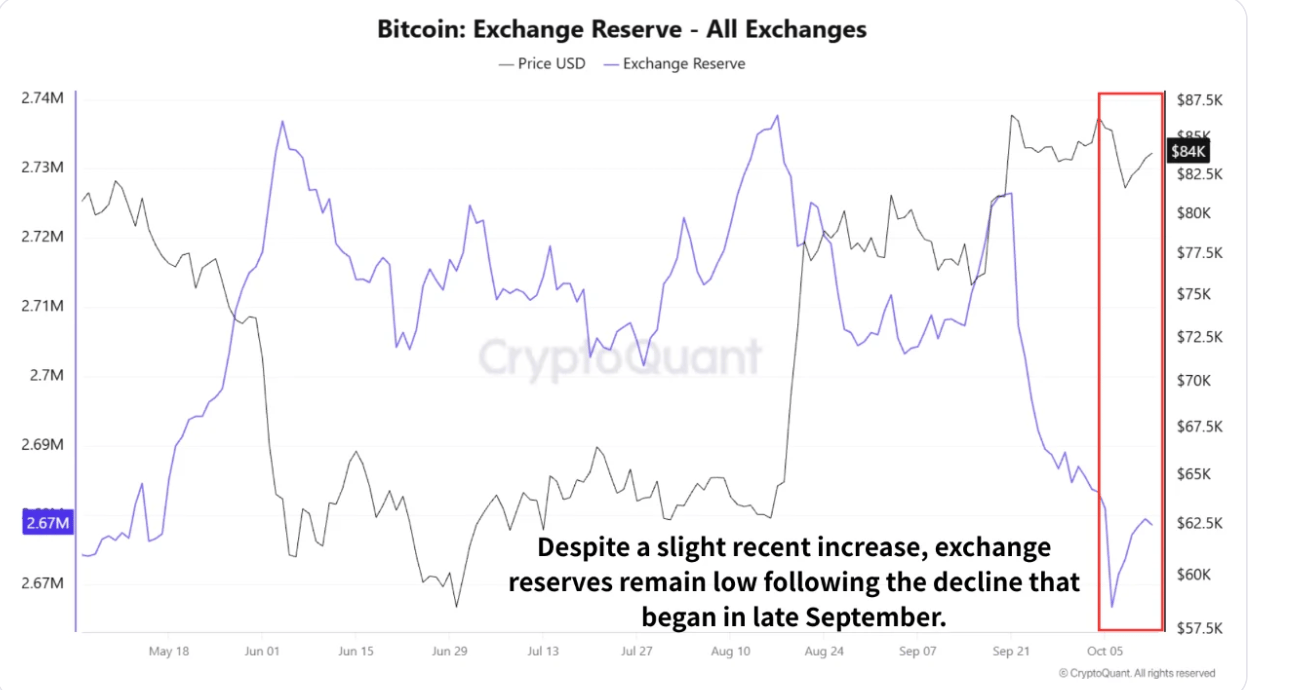
Bitcoin Exchange Reserve. Source: CryptoQuant

Bitcoin's Apparent Demand metric has also recovered sharply from deeply negative levels. Its improvement suggests that demand conditions are recovering from previous weakness.

XWIN also said whale holdings have climbed to about 3 million BTC and remained elevated throughout the recent price correction.

The report points to easing Oil prices and the approaching US midterm elections as potential factors that could improve market conditions. Brent crude had fallen from nearly $110 to around $103, while the election could provide greater clarity on the political outlook and help investors reassess their allocations.

The analyst shared that these metrics “suggest conditions for a bottom are improving.” Sustained ETF inflows, stronger US spot-market buying and continued demand recovery would provide more convincing confirmation, the report stated.

BTC is trading at $82,620, down 1% in the past 24 hours at the time of writing.

Disclaimer: For information purposes only. Past performance is not indicative of future results.
placeholder
October hike odds climb toward 60% as Goldman and BofA both flip — what Warsh's "dose of accommodation" really changedRate futures now price roughly 55% to 62% for a 25bp hike at the October 27-28 FOMC, up from about 30% before Chair Warsh's post-meeting framing that the Fed is merely "removing some accommodation." Goldman Sachs has added an October hike to its forecast and Bank of America now sees moves in both October and December. Here is the repricing, the language behind it, and the two data points that decide it.
Author  Irene Q.
Sep 23, Wed
Rate futures now price roughly 55% to 62% for a 25bp hike at the October 27-28 FOMC, up from about 30% before Chair Warsh's post-meeting framing that the Fed is merely "removing some accommodation." Goldman Sachs has added an October hike to its forecast and Bank of America now sees moves in both October and December. Here is the repricing, the language behind it, and the two data points that decide it.
placeholder
Strong profits, falling shares: bank earnings day one meets a memory-chip rout — with CPI and ASML aheadGoldman Sachs blew past estimates (EPS $17.01 vs $13.09 expected, profit +33%) while JPMorgan missed ($5.75 vs $5.93) and Wells Fargo fell 3% — yet the S&P 500 finished flat at 7,805.45, pinned below its record close as a memory-chip rout (SOX −2.67%, Micron under $1,000) kept the pressure on. Tonight brings the week's decider: US September CPI at 8:30 ET, then Bank of America, Morgan Stanley, BlackRock and ASML before the open. Here are the levels, both cases, and the watch list.
Author  Irene Q.
Oct 14, Wed
Goldman Sachs blew past estimates (EPS $17.01 vs $13.09 expected, profit +33%) while JPMorgan missed ($5.75 vs $5.93) and Wells Fargo fell 3% — yet the S&P 500 finished flat at 7,805.45, pinned below its record close as a memory-chip rout (SOX −2.67%, Micron under $1,000) kept the pressure on. Tonight brings the week's decider: US September CPI at 8:30 ET, then Bank of America, Morgan Stanley, BlackRock and ASML before the open. Here are the levels, both cases, and the watch list.
placeholder
US September CPI recap: inflation hits 3.7% as core runs hot — is an October Fed hike back on the table?September CPI landed hot: headline 3.7% y/y, core 2.6% y/y and 0.3% m/m. October hike odds jumped from ~22% to ~37% — yet the dollar faded to 101.74, gold closed higher and the S&P 500 fell 1.11%. Here is the full repricing, the levels and what to watch next.
Author  Irene Q.
23 hours ago
September CPI landed hot: headline 3.7% y/y, core 2.6% y/y and 0.3% m/m. October hike odds jumped from ~22% to ~37% — yet the dollar faded to 101.74, gold closed higher and the S&P 500 fell 1.11%. Here is the full repricing, the levels and what to watch next.
placeholder
Gold defends $4,100 as BofA targets a break below $4,000 — why the Middle East bid is missingSpot gold flushed to $4,099.89, a whisker above October's $4,090 low, then rebounded to close at $4,138.25 (+0.82%) — even as US CPI ran hot. Bank of America sees gold below $4,000 within three months, citing shrinking demand and official-sector selling. Here are the levels, the drivers and what would flip the script.
Author  Irene Q.
22 hours ago
Spot gold flushed to $4,099.89, a whisker above October's $4,090 low, then rebounded to close at $4,138.25 (+0.82%) — even as US CPI ran hot. Bank of America sees gold below $4,000 within three months, citing shrinking demand and official-sector selling. Here are the levels, the drivers and what would flip the script.
placeholder
Gold Price Analysis Today | Forex Gold Analysis | XAU/USD Analysis - October 15, 2026Get the latest gold price analysis, forex gold insights, and XAU/USD analysis for October 15, 2026. Read on for the details.
Author  Mitrade
22 hours ago
Get the latest gold price analysis, forex gold insights, and XAU/USD analysis for October 15, 2026. Read on for the details.
Related Instrument
goTop
quote